Spot Check pt. VI
firmware repo
node.js api repo
iOS app repo
hardware repo
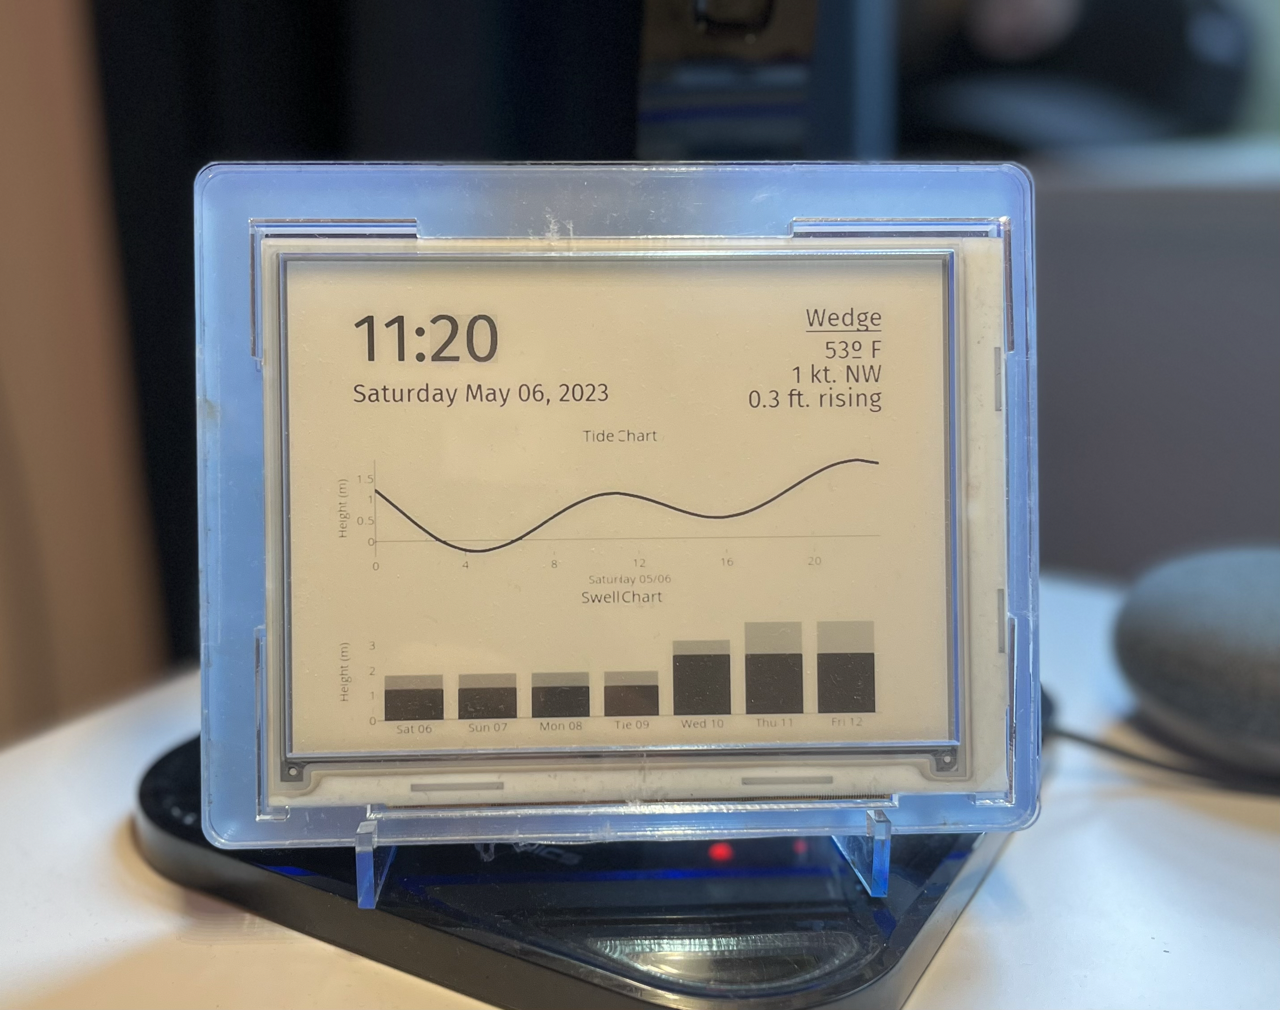
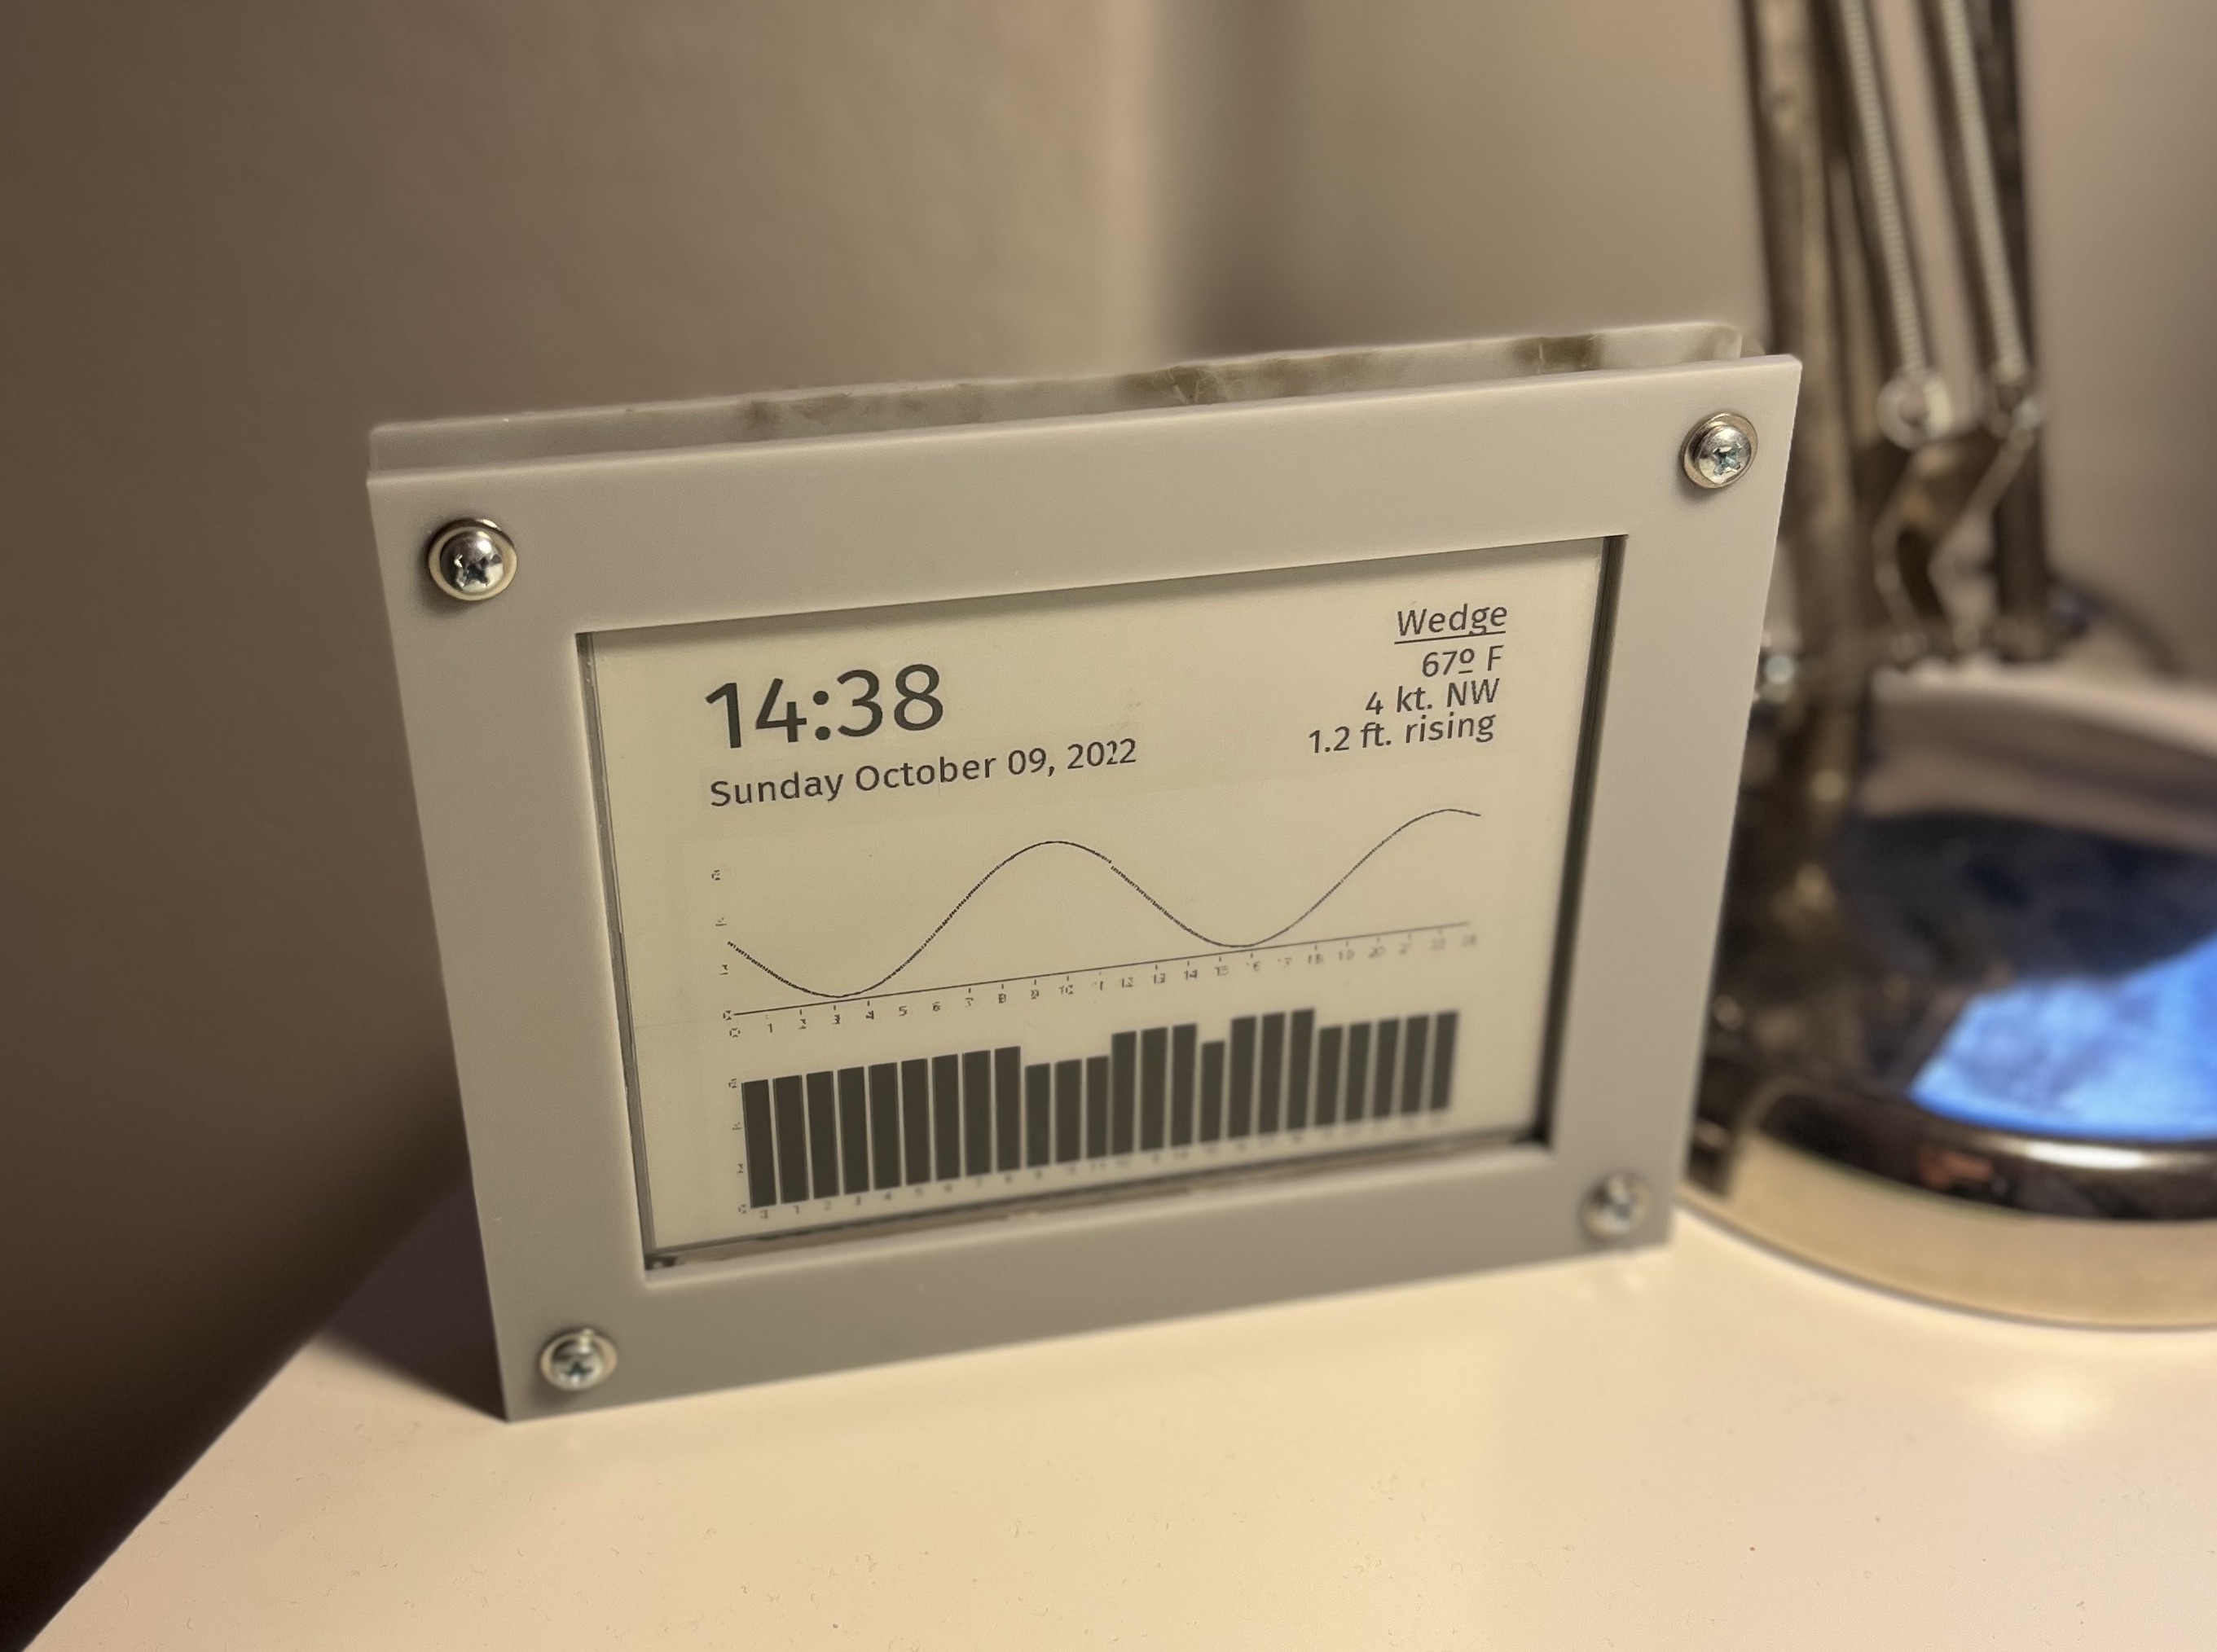
The standard Spot Check forecast screen in a new prototype enclosure from lasercut acrylic layers
Previous project updates:
Overview
I’ve procrastinated so long on this writeup that I can barely remember all of the new things that have been added to the firmware. It’s a complete overhaul from the previous version from the bottom up with a new architecture for scheduling periodic tasks, displaying data in a new format, and overall better firmware practices.
New and updated features
UX/UI changes
The largest change is the switch from the LED strips that displayed a single line of scrolling text to an e-ink display. The display resolution is 800x600 pixels and can clearly show much more detail than just a single line of text. It’s also not just limited to text - the current design that I’ve landed on for data display involves the time and date in the upper left quarter, the windspeed/direction and tide height in the top right, and two full-width graphs of the day’s tide levels and the week’s swell heights. You can see the sketches of several different designs that I iterated on below.
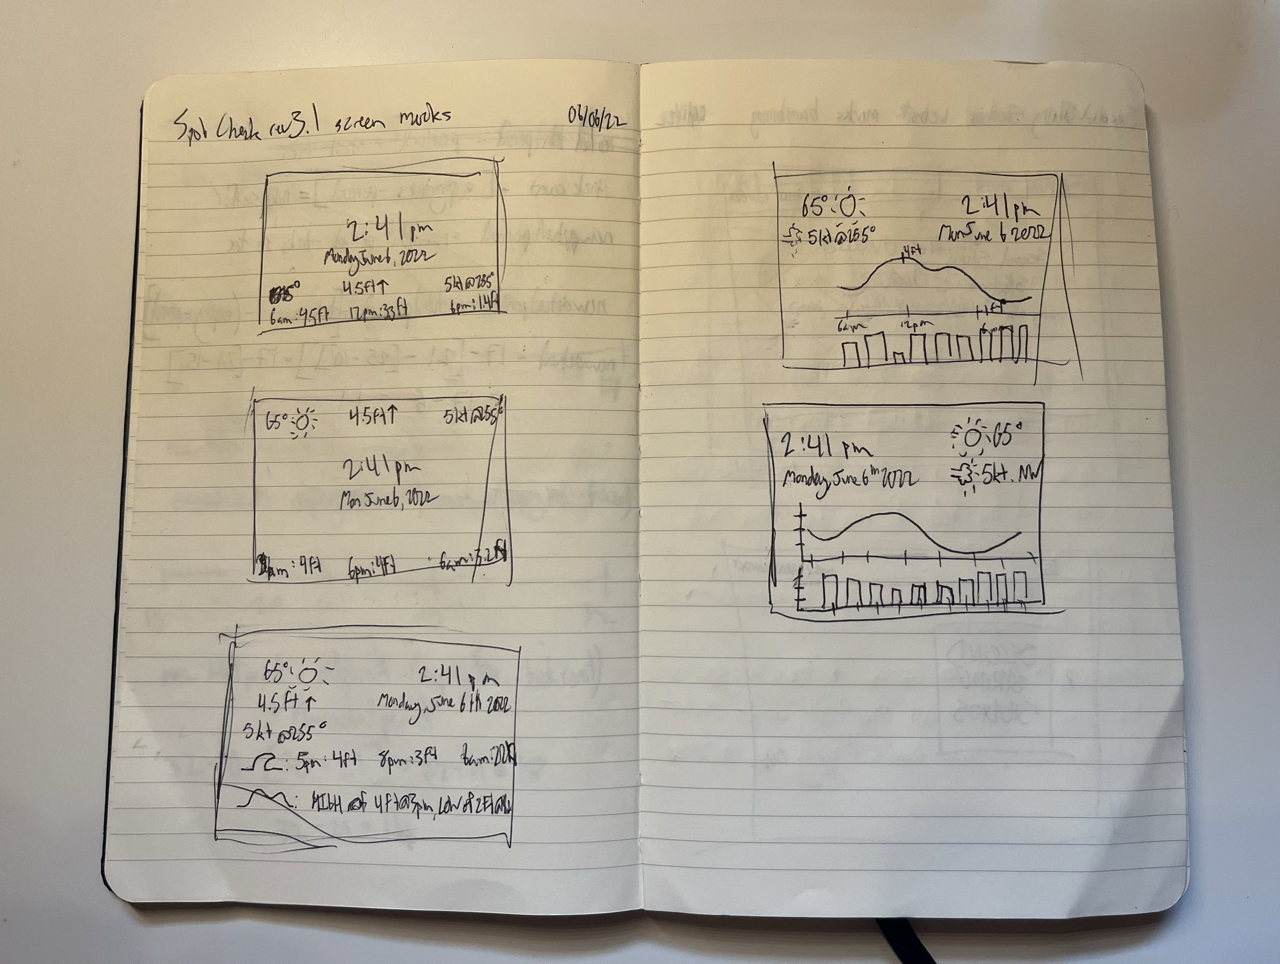
Different iterations of screen layouts
The time updates every minute (obviously), the wind and tide conditions update every hour, the swell chart updates three times a day (to pull in any forecast changes that occur), and the tide chart only updates once at the beginning of each day (tides are known and don’t change).
This data layout is best for partial screen updates. Because of the physics and technology behind driving e-ink displays, refreshing the entire screen with no leftover artifacts requires a fair amount of time (around 1 full second) and multiple black-and-white flashes of the screen. Partial screen updates limit the effects of screen fade and flashing to only where it’s necessary. There are a few other optimizations I’ve added in the firmware to help the display changes be as unobtrusive as possible. For example, one is inverting text to clear it instead of clearing the full bounding box to avoid the screen flashing.
API changes
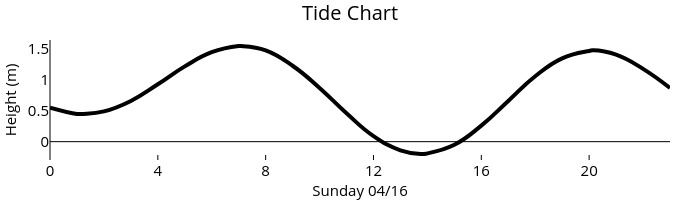
The previous API has remained mostly unchanged for backward compatibility, but I pulled in plotly.js to help render the charts. This way I can use the processing power of the server to render nice charts, and then just send the raw bitmap data to the device to push directly on the screen.
The swell (top) and tide (bottom) charts rendered on the server and sent to the firmware as raw packed bytes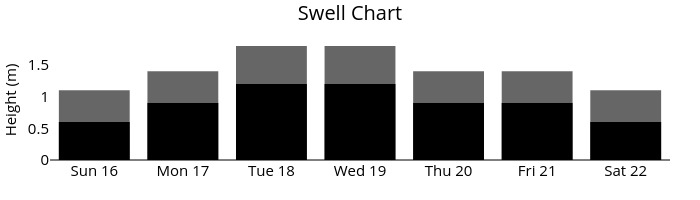
There were some tweaks around how many days of data are pulled from Surfline and the weather API to display the most useful data in the charts, and I did some cleanup and centralized some of the logic around the API server layer and the graphic rendering layer.
Firmware changes
As I mentioned, this list is too long to outline fully and to describe each change. Here is a non-exhaustive list of the most major changes with a short description for each.
- Removing all LED strip-specific code and replacing those libraries with the epdiy open-source e-ink driver library (forked and customized a bit)
- Full refactor of the system by which events (like OTA check, time or conditions update, etc) get scheduled and execute periodically in a non-blocking manner
- The use of SNTP time to sync time over network and use real-world time with the RTC instead of just ticks since boot
- A full CLI over UART with over 20 individual commands for things like firmware/hardware version printout, I2C bus control of the battery charging chip, querying the API with custom endpoints, and more
- Refactoring task management and centralizing task creation and start
- Some new drivers for things like the TI battery charging IC and CD54HC shift register
- Integrating Memfault for remote core dump debugging and fleet monitoring
- Expansion of NVS partition map to accommodate saving the chart images from the server as well as Memfault core dumps
- Update to esp-idf 5.0
- The use of SNTP time to sync time over network and use real-world time with the RTC instead of just ticks since boot
Enclosure
The design for the housing remains one of the biggest sticking points for me as I don’t enjoy this aspect of product design as much. Or rather I enjoy it, but I’m not very good at it.
I started with the simplest possible option - lasercutting a flat frame for the front screen, and a matching rectangle to act as the back. The screen was hot glued into the frame, the board glued to the screen, and the two lasercut pieces attached at each corner with M3 screws and standoffs. You can see in the picture below that it was not winning any design awards, but it was better than a PCB and screen lying flat on my desk.
The biggest constraint with the enclosure design is getting the screen fixed into place, as it has no mounting points. The flex cable from the screen to the PCB is also very short, so the board has to be properly fixed somehow very close to the back of the screen, but not the screen itself.
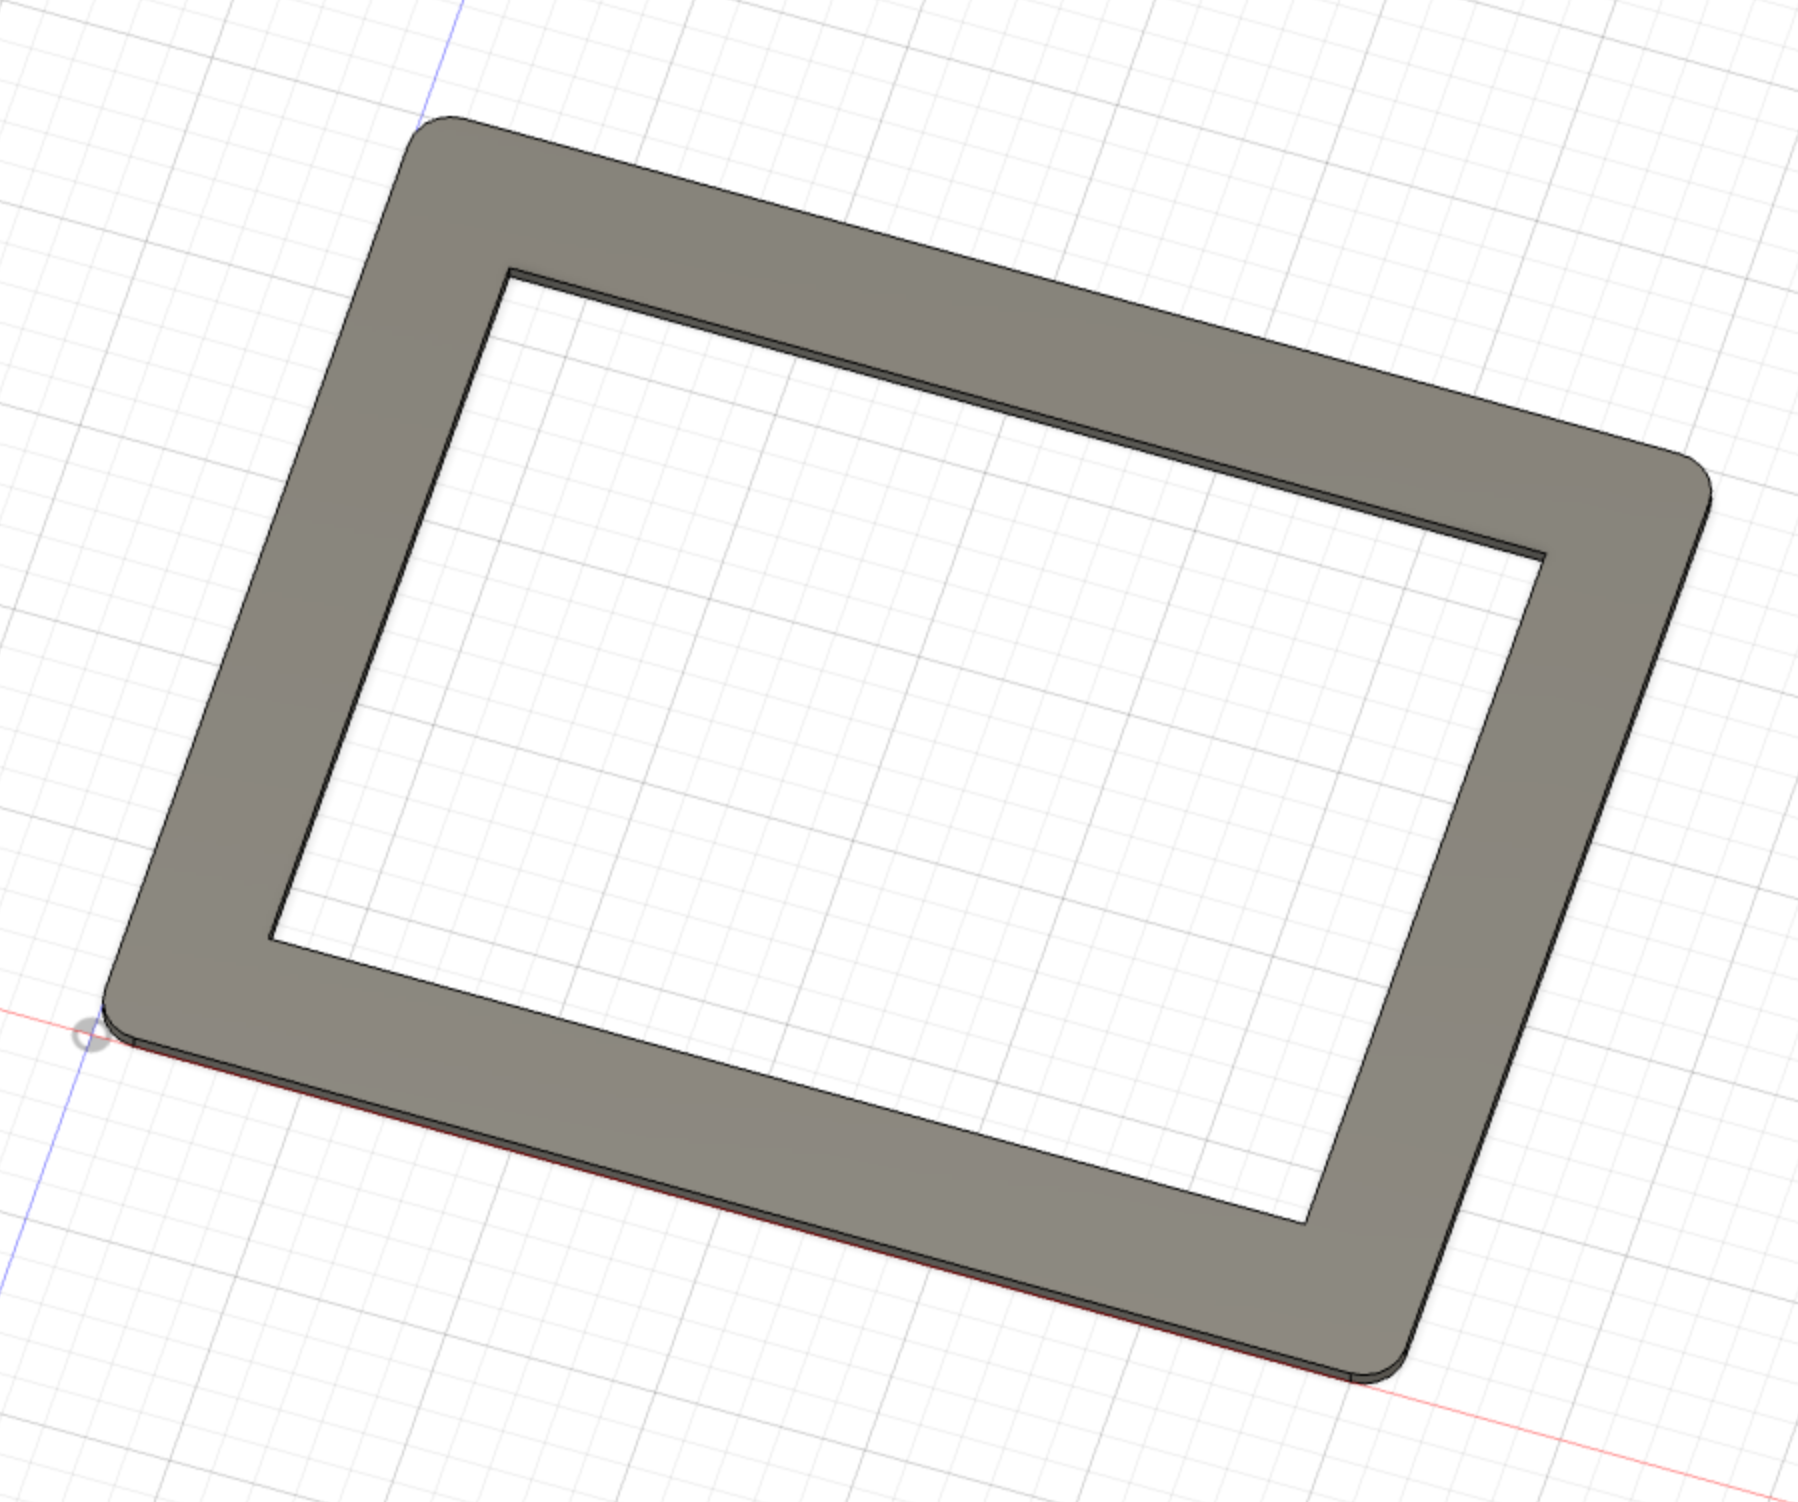
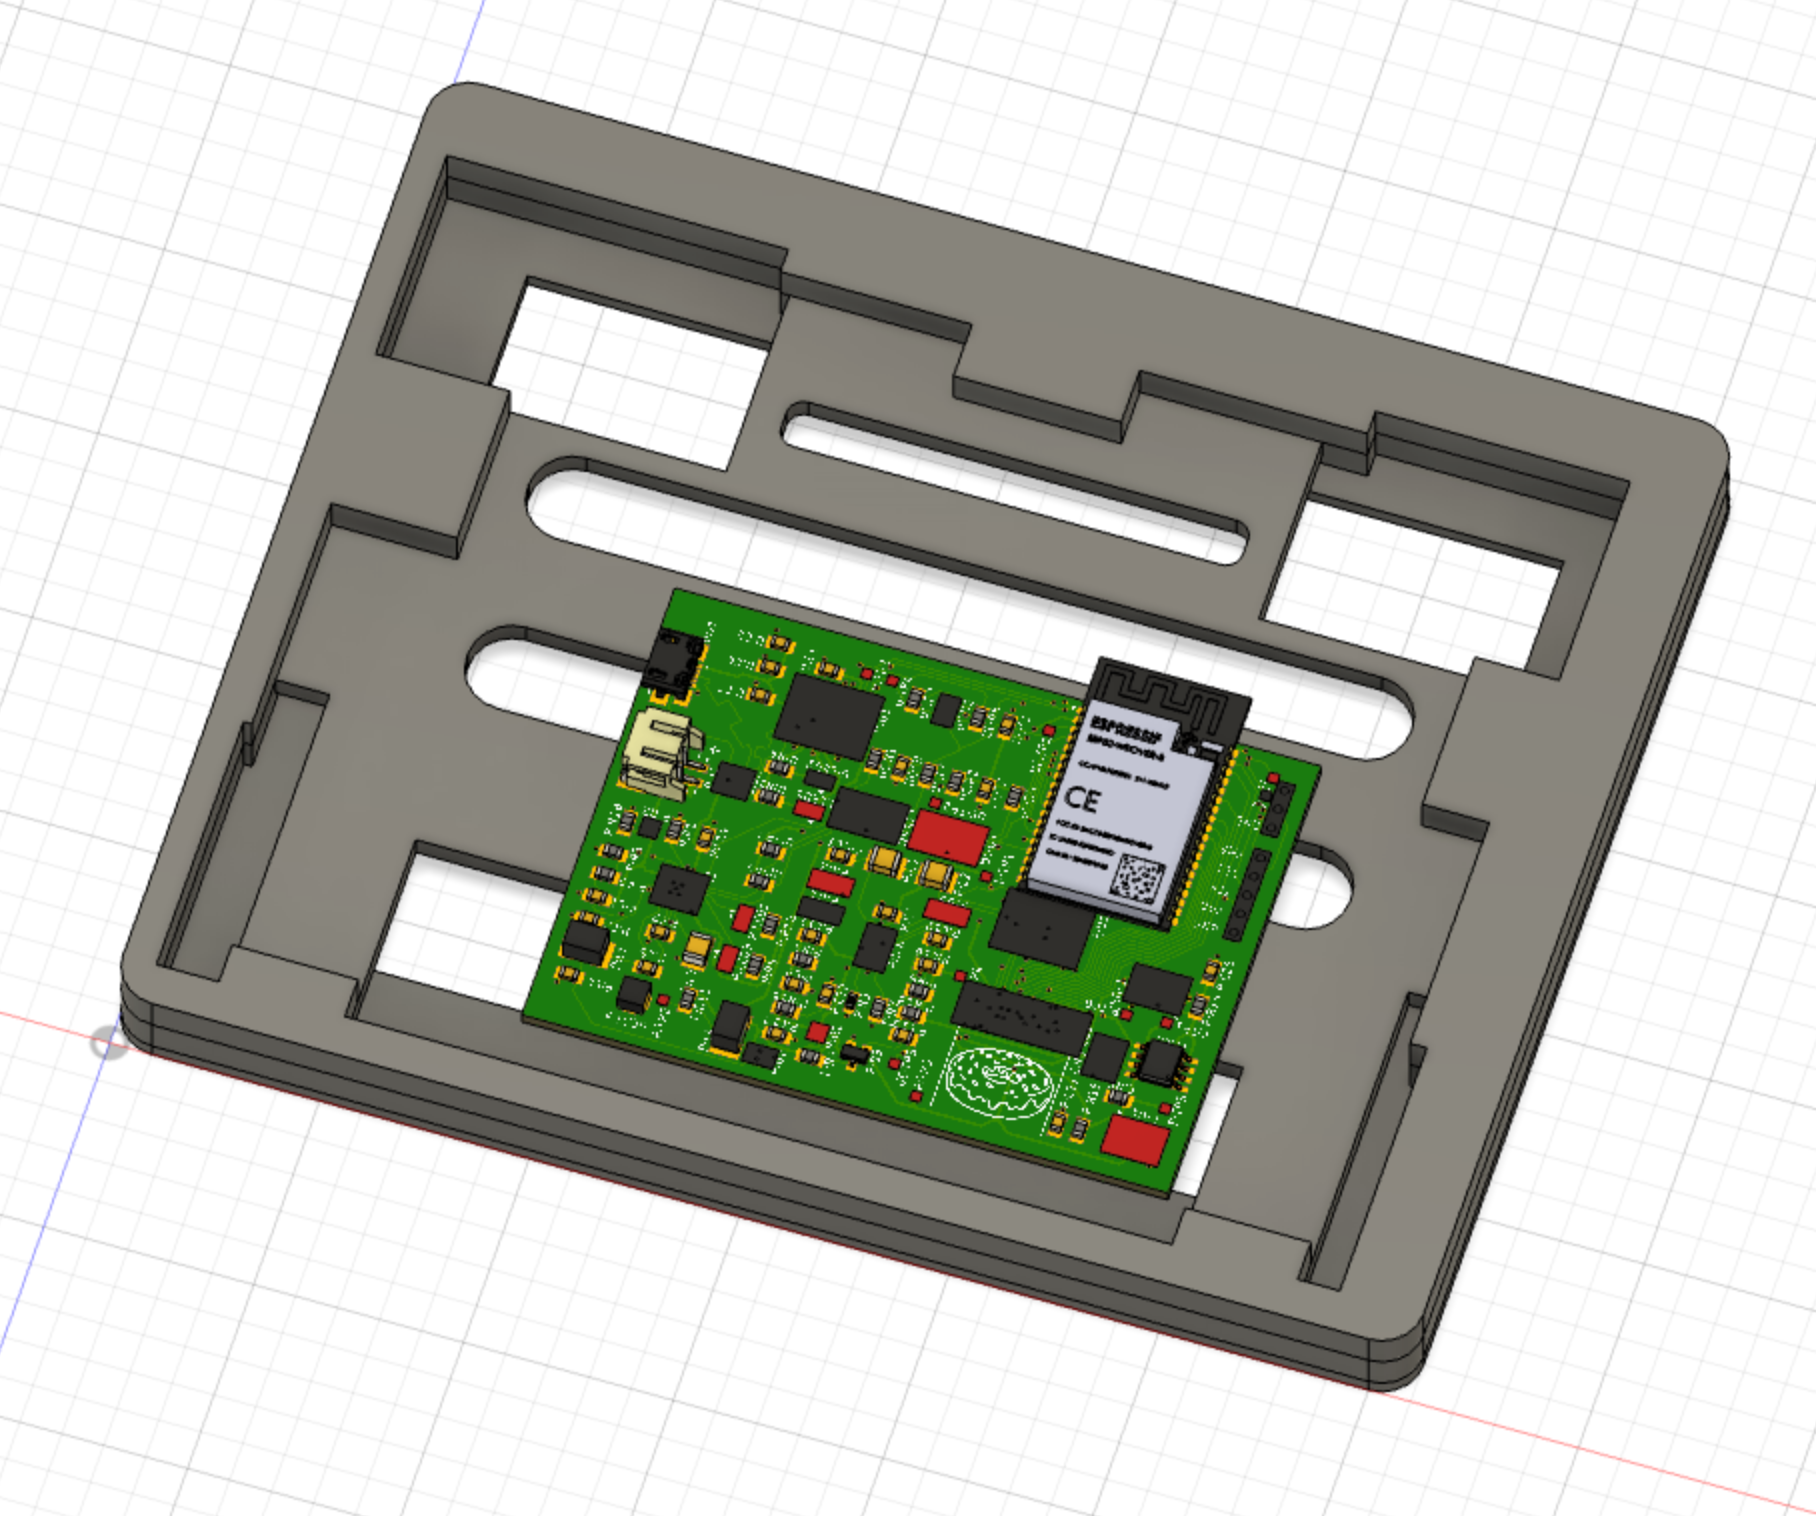
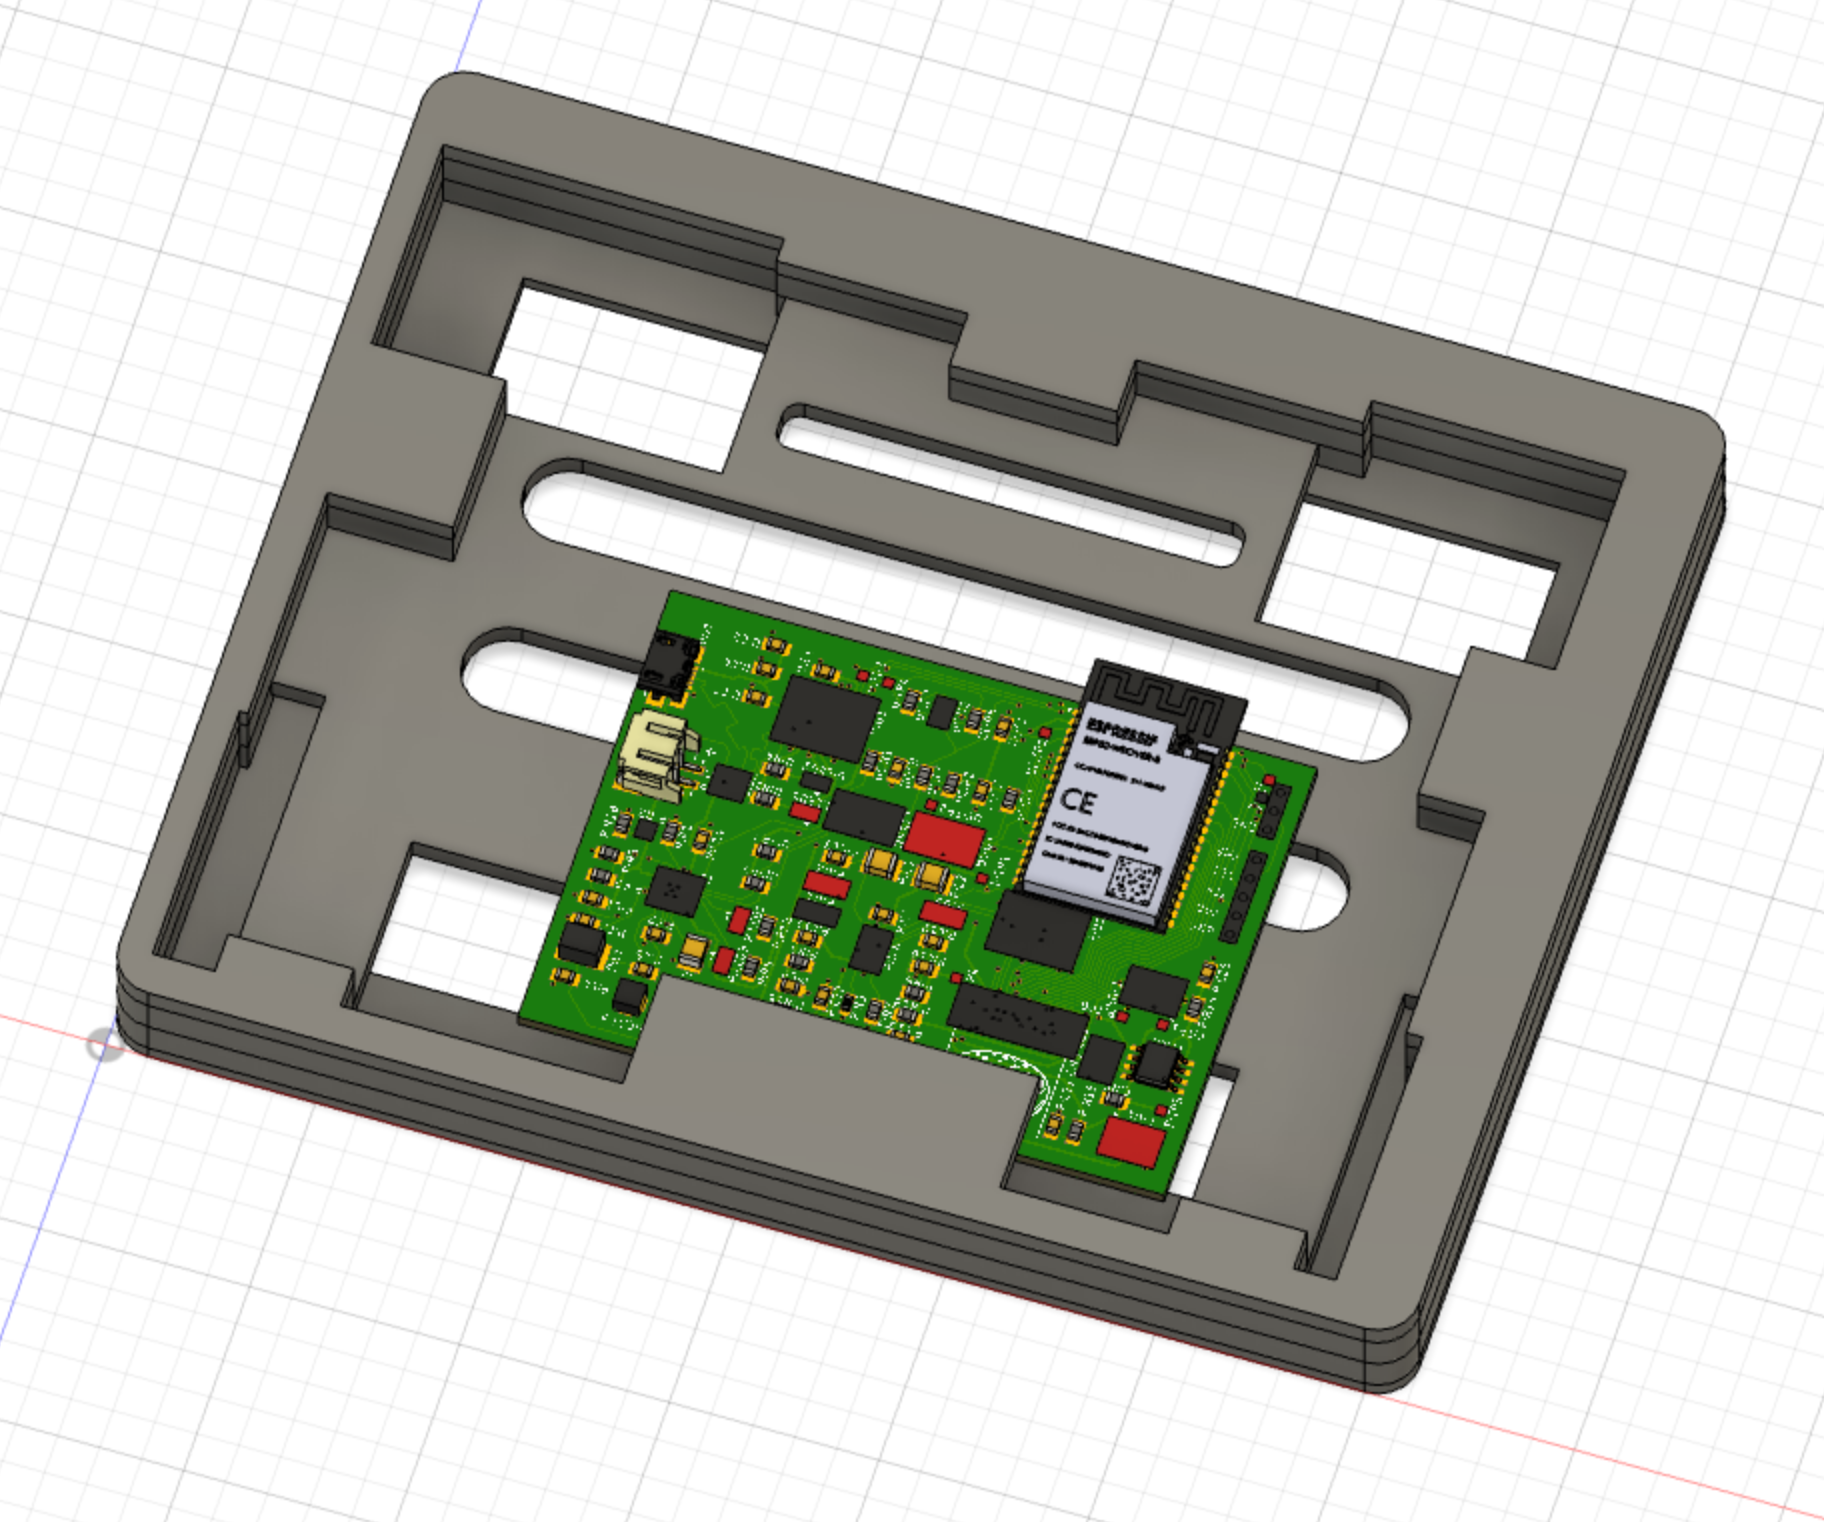
I got a little closer to a solution by designing a series of layers of lasercut acrylic that stack up into a full frame. The layers from front to back are:
- Frame in front of the screen, user-facing (I switched to rounded corners - much nicer)
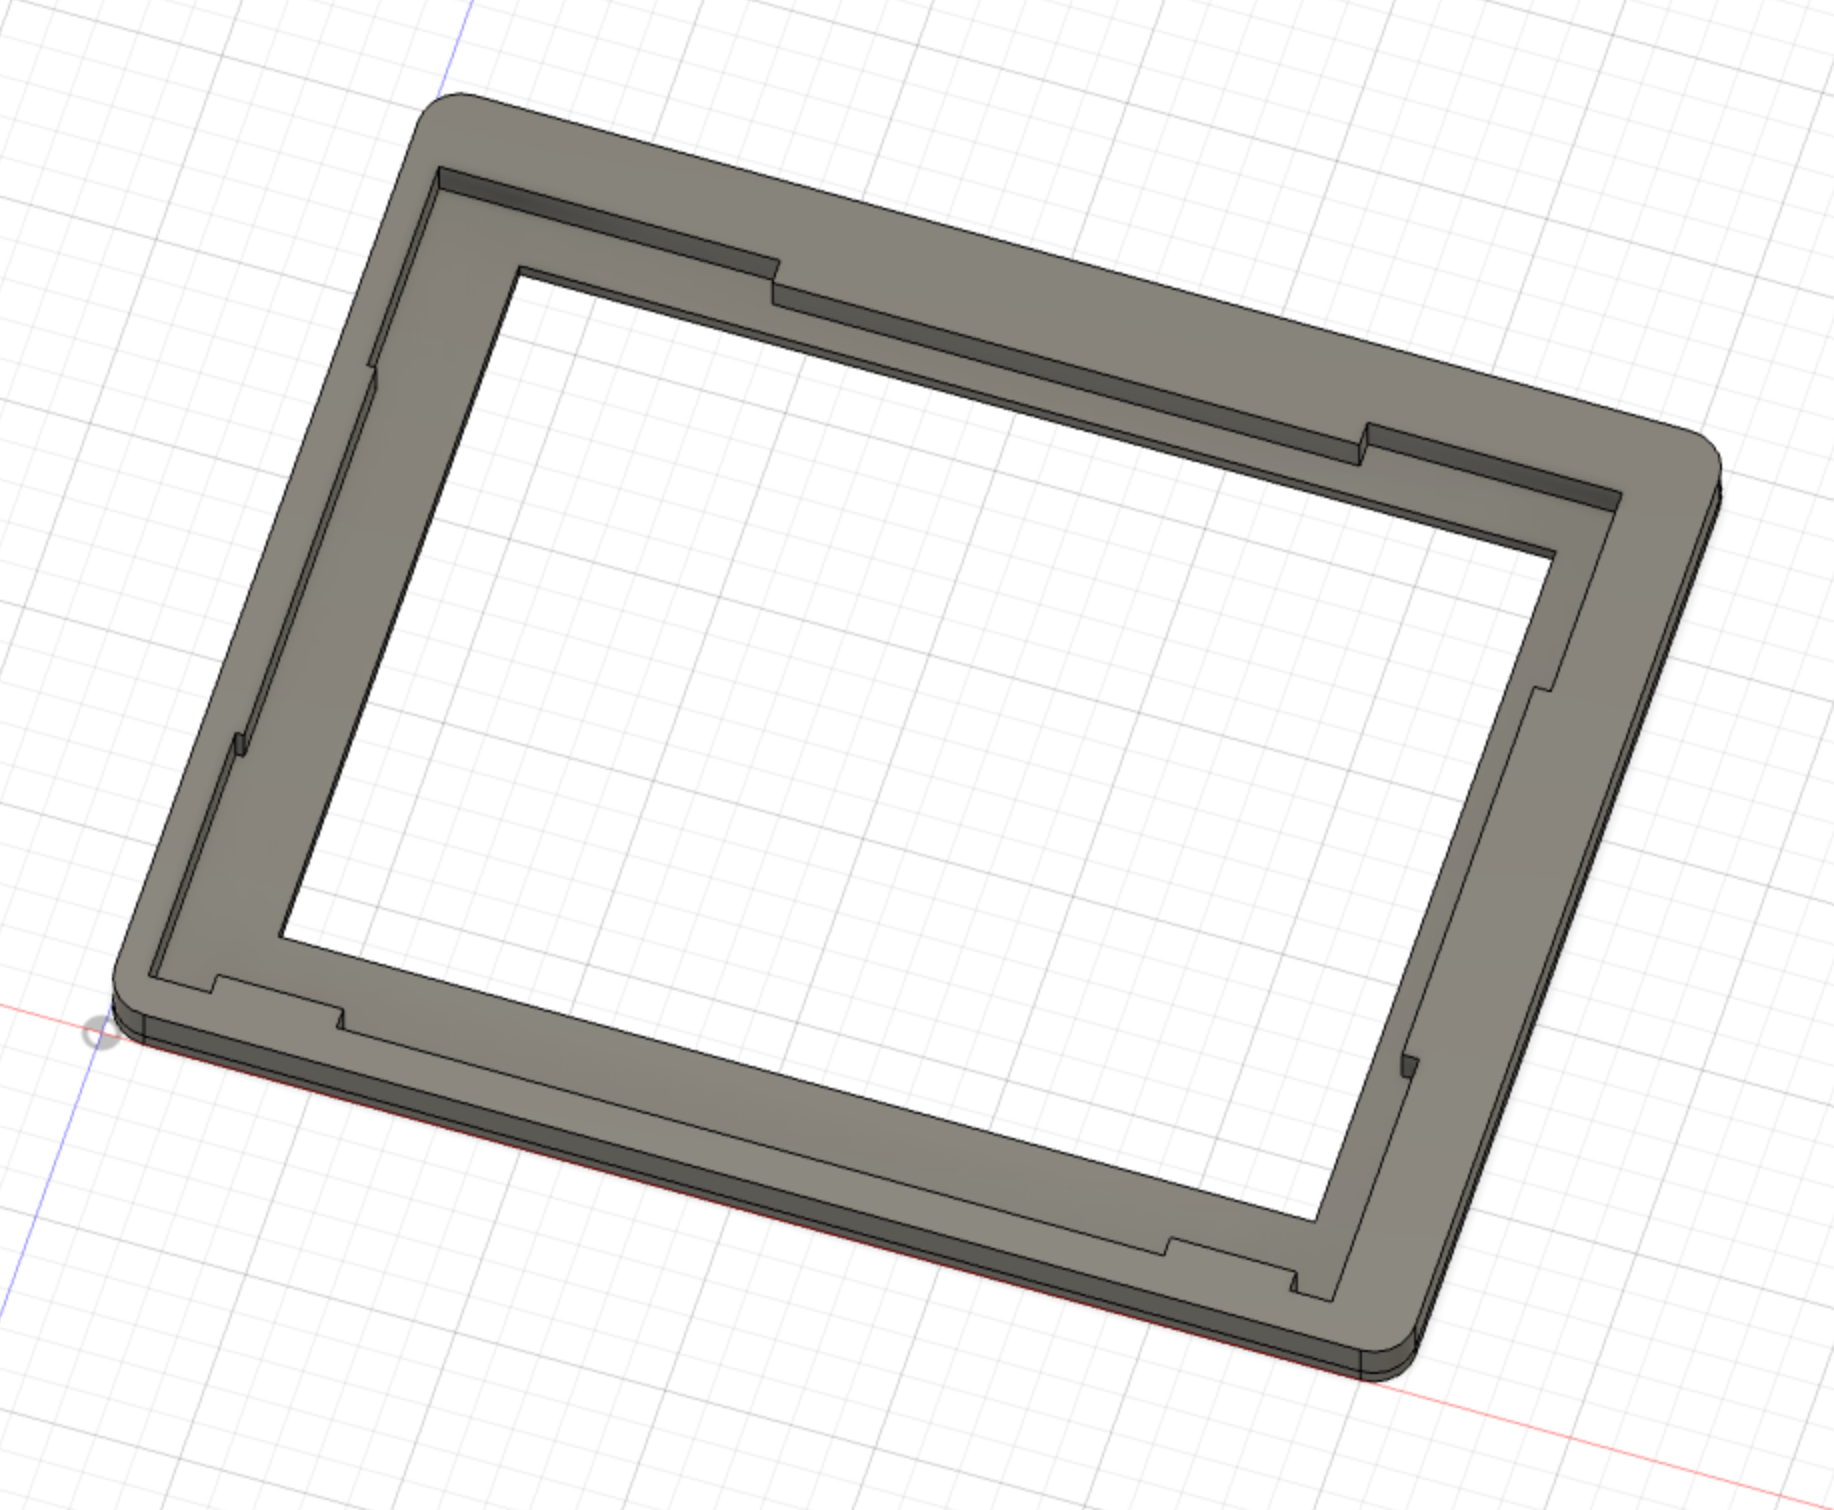
- Border around the screen with cutouts on each side to fit the edges of the screen snugly with no sideways or up-and-down wiggle
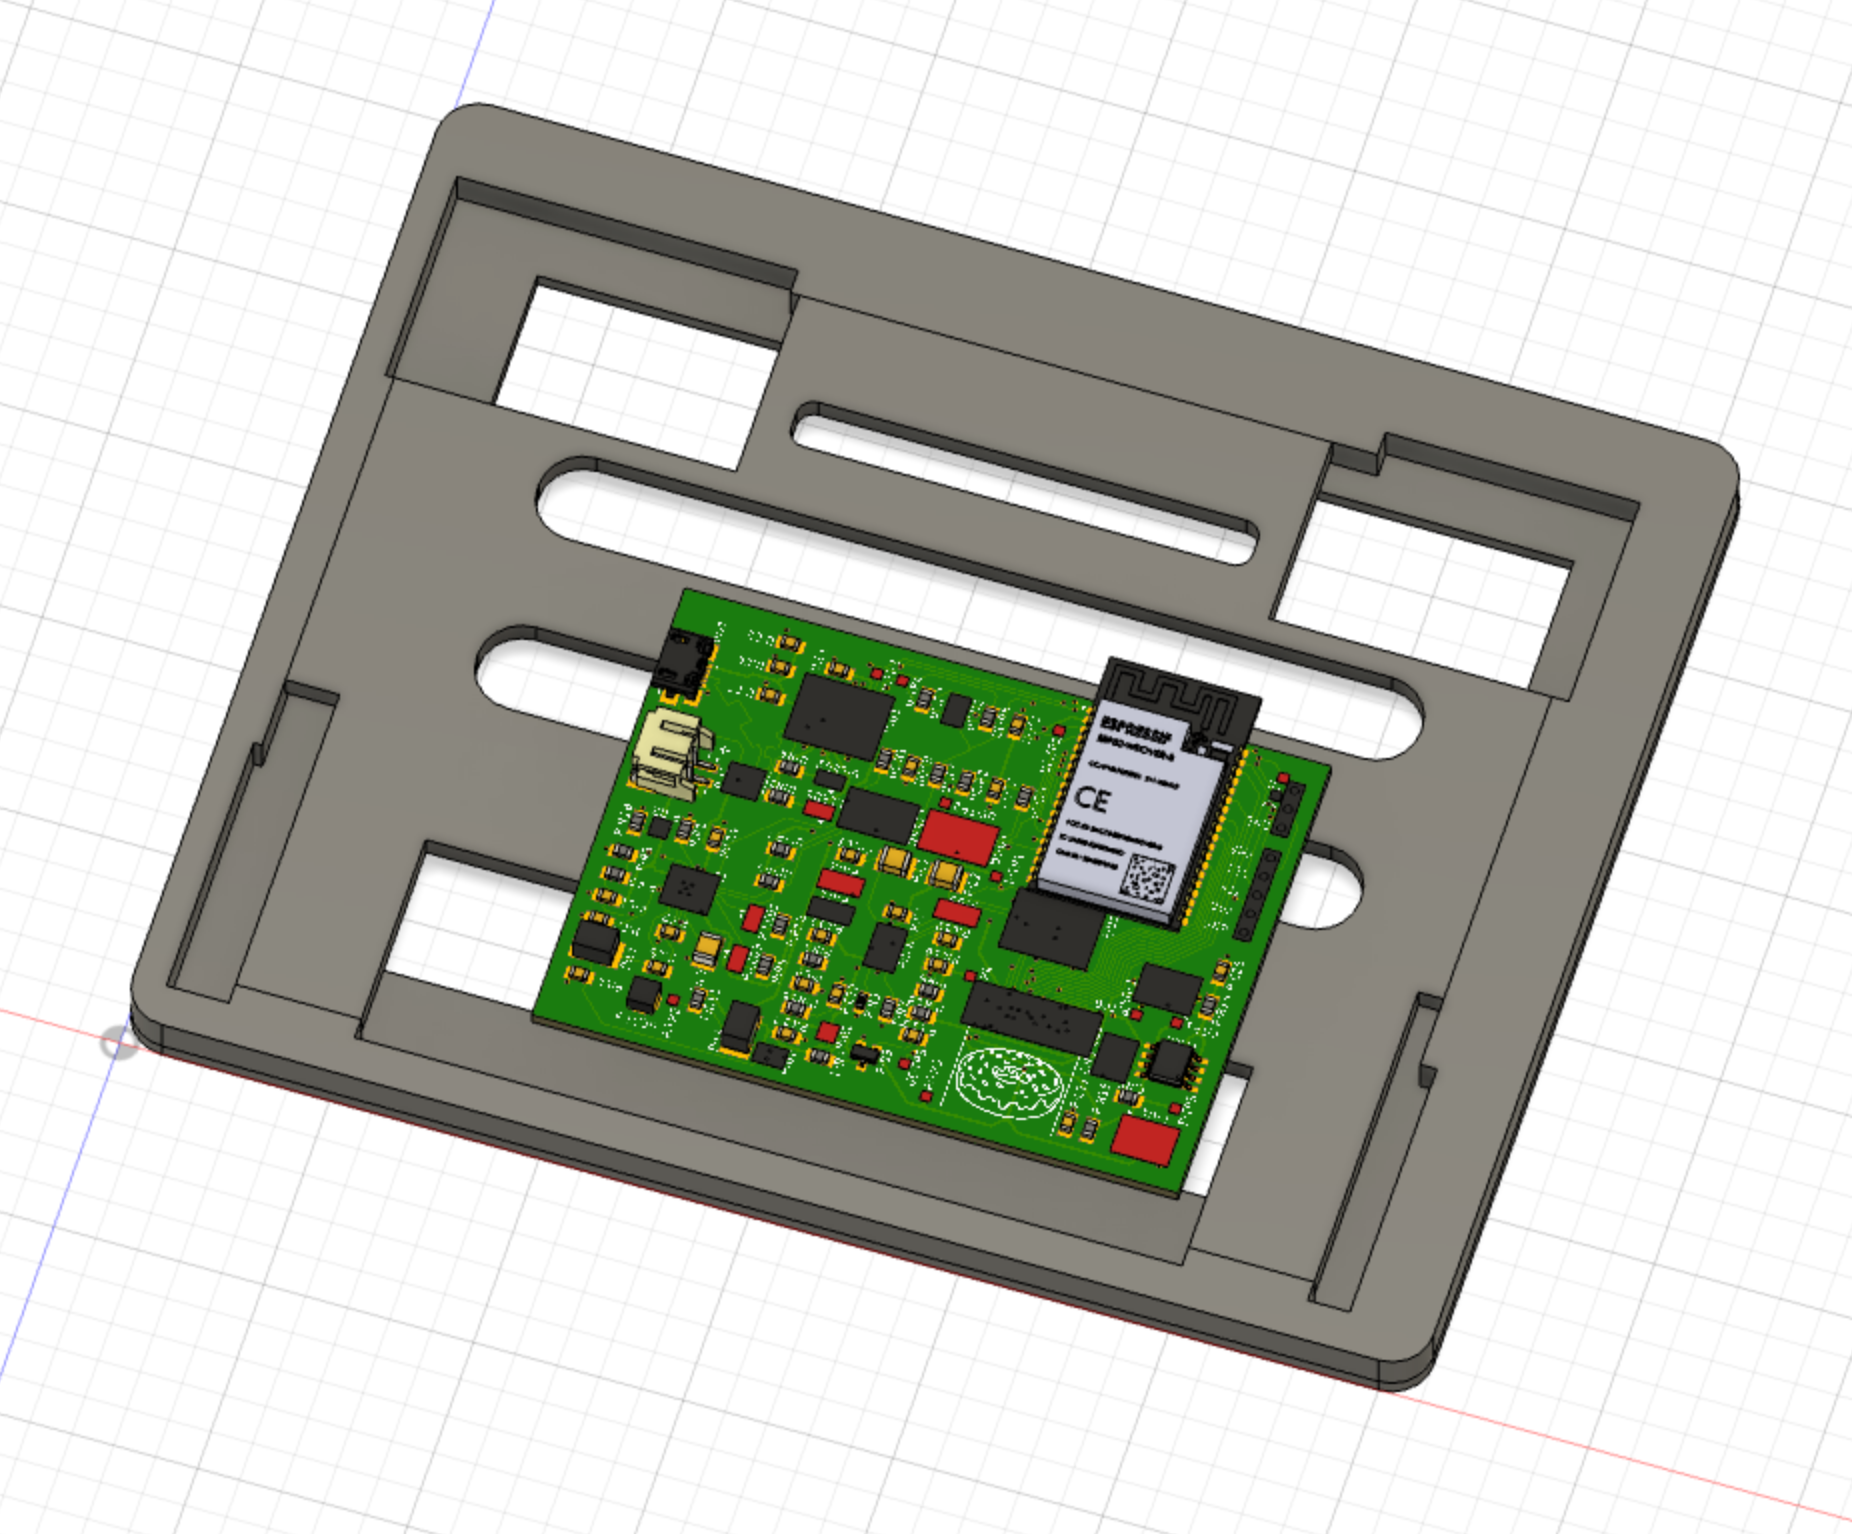
- An insert of thinner acrylic than the acrylic in layer two that lays on the back of the screen and makes snug contact on the sides and top/bottom with the layer two border. The PCB is screwed into this insert, and it holds the screen in place
- Another border that has cutouts that protrude closer to the center on each side which holds the 2.5 cutout from behind, and is thicker than the other layers to provide enough vertical space for the PCB
- Another border with cutouts and also a longer protrusion along the bottom edge to provide even pressure on the long screen flex cable to keep the insertion into the PCB even
- The rear covering with a hole cut out for the power cable
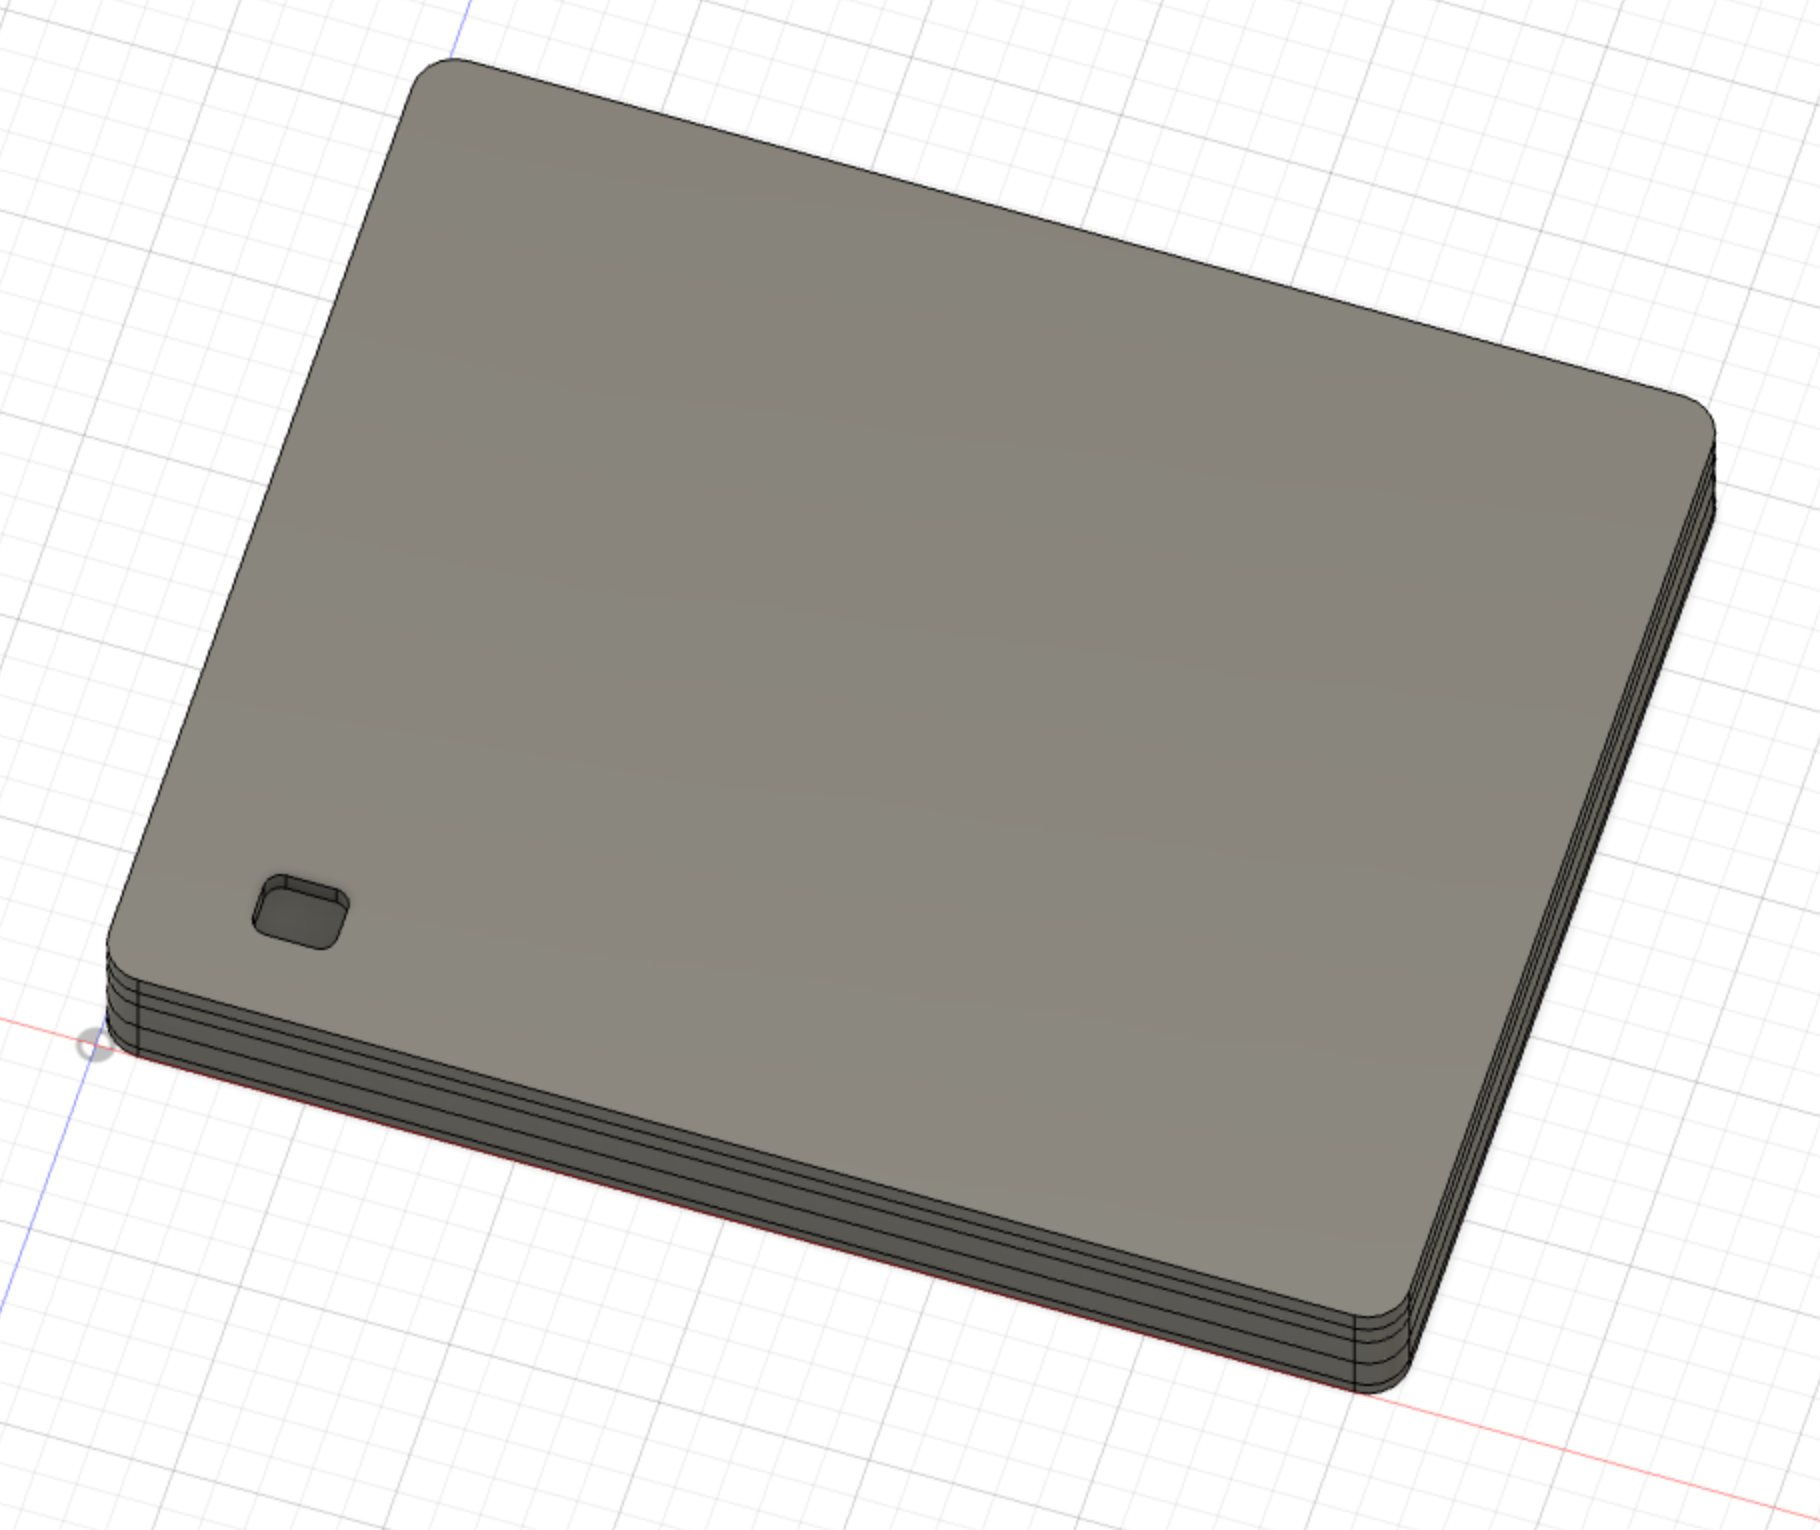
The entire enclosure is constructed by taping or gluing each layer together. This definitely is not the final design but helped prototype how to design the inner shapes to properly hold everything in place and to test tolerances.
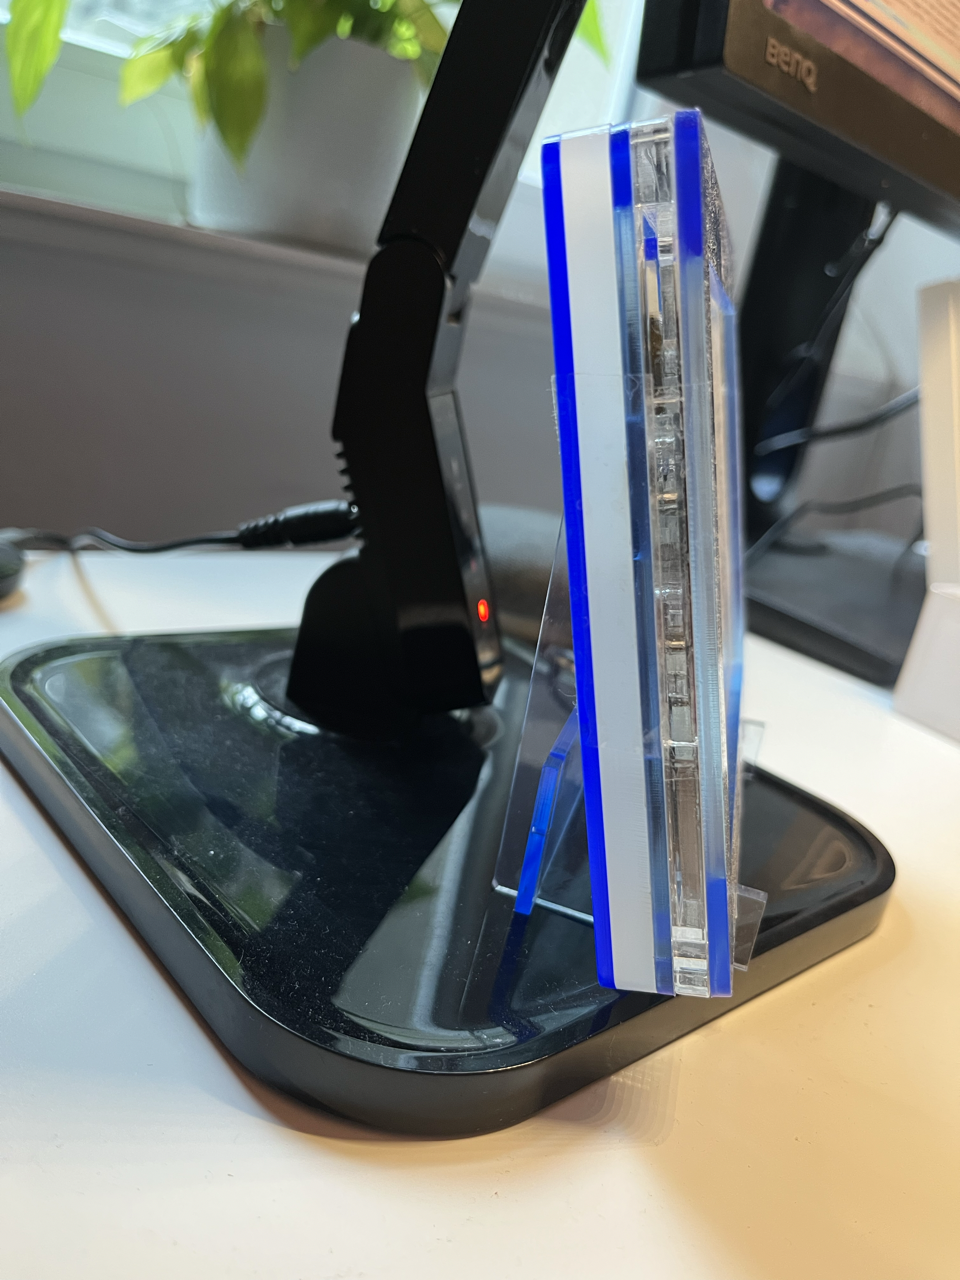
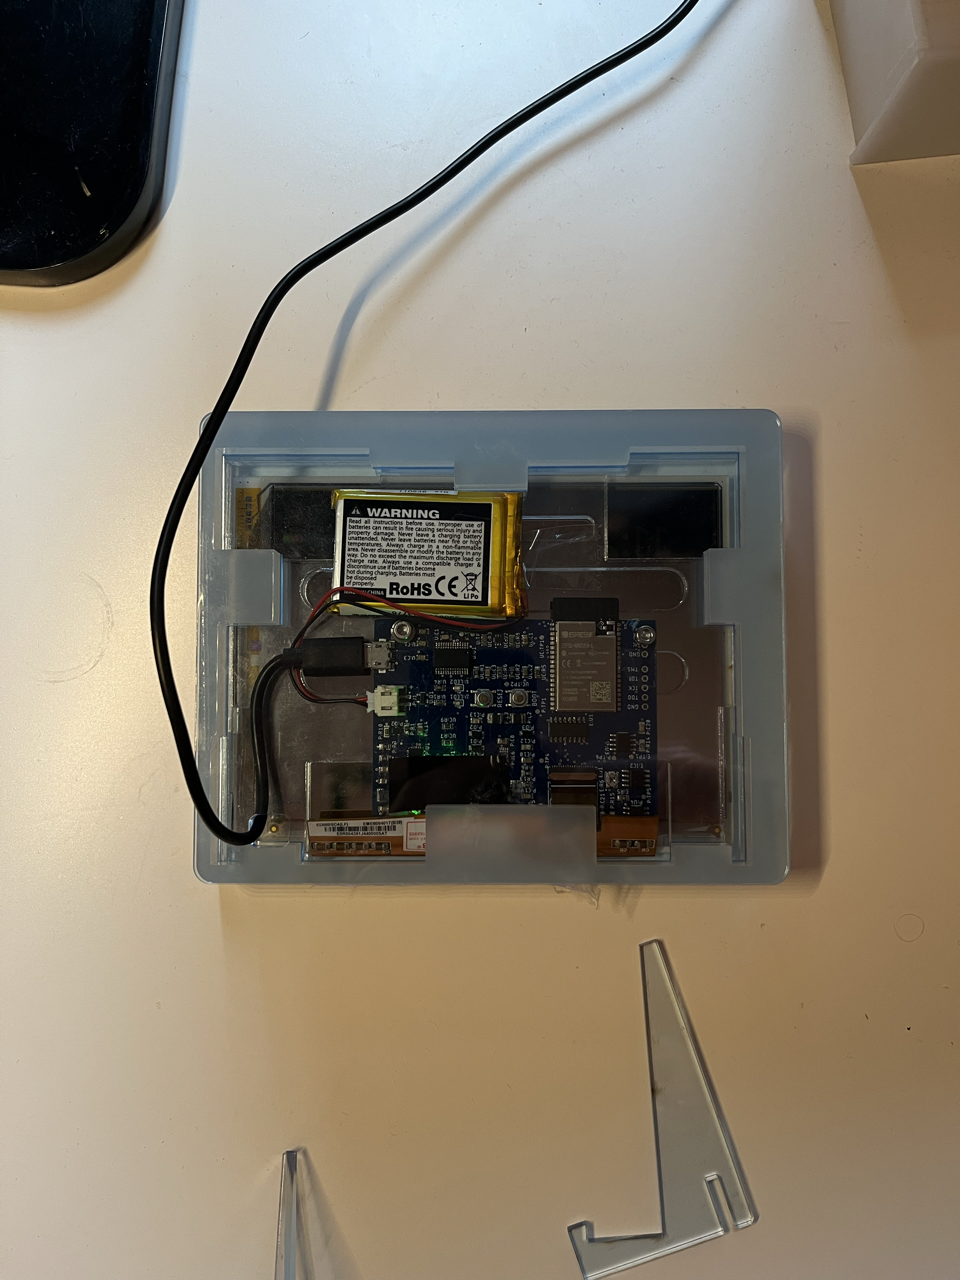
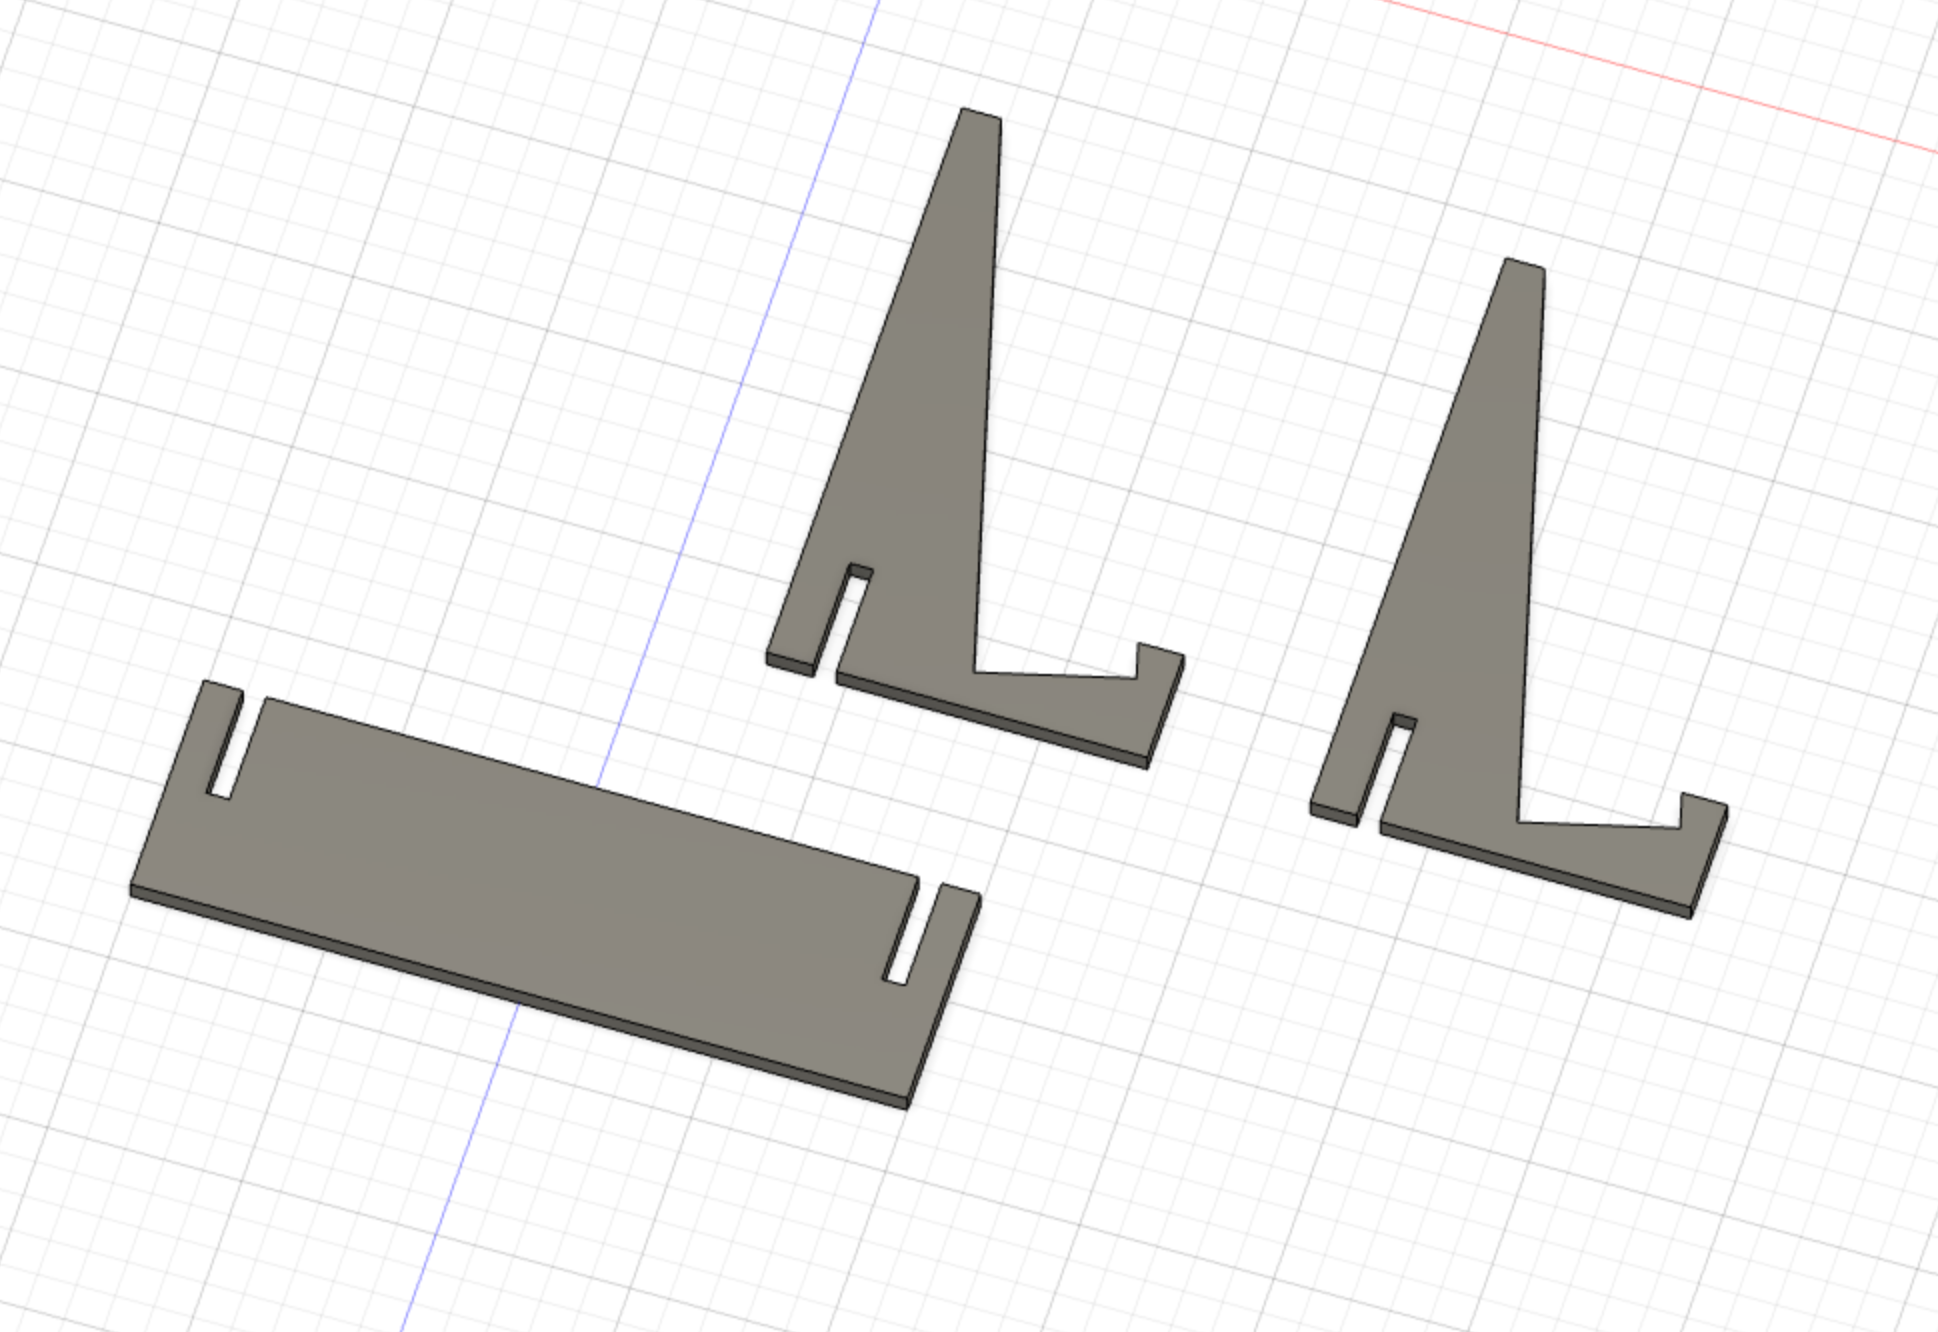
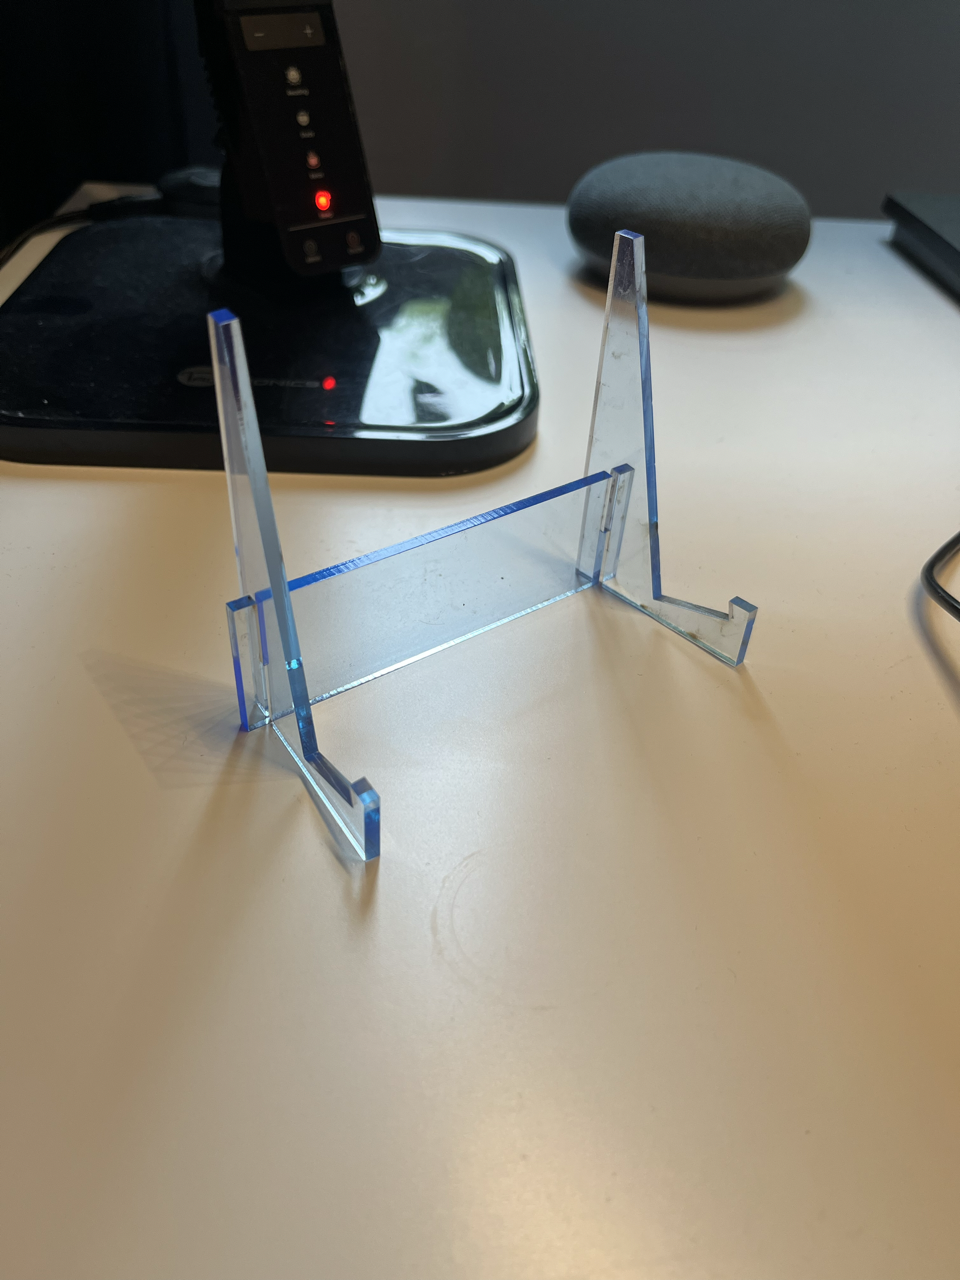
I designed two small legs connected by a bar that the enclosure rests on to have a better viewing angle. Sometimes simpler is better.
Next steps
Getting the enclosure finalized is the main thing remaining. I would like to either 3D print or mill it out of wood so that the front and sides are all one piece, and the lasercut spacers for positioning the screen and PCB are slid down into the single piece. Then the back can be screwed directly on. I’d like to test a smaller screen as well, since the fancy charts are a bit of a nice-to-have and could be represented smaller in just text.
I would also like to add some more functionality to the firmware for different display data. The swell height and tide don’t do me too much good in the landlocked city of Berlin where I live now, so integrating a calendar or other, more pertinent, data would be nice.
There are some things like the battery charging and more integrated power rail regulation for the display that will need to be changed in the next board rev. I don’t have plans for another board spin any time soon because I don’t want to have to deal with finding alternate parts for everything that I’m sure is out of stock now, but it will need to be done eventually.
For now, the device has gotten to a fairly stable point where I can actually use it as it’s intended and do some dogfooding instead of it still being in development mode all the time.