CubeMX lets you shoot yourself in the foot by default
Coming from the land of TI MSP430 bare-metal embedded development, the fact that ARM Cortex-M chips give you a fancy GUI to set up your GPIO, clocks, etc., was mind-blowing. I realized I didn’t need to hunt through the datasheet for every little initialization register and clock speed I needed to set manually, I could just click a pin and have it fully set up through the HAL.
Granted, people have a lot of gripes with the potentially buggy ST HAL and the code generated by CubeMX, but I haven’t used it enough to run into any situations like that. I can just hack out any wasteful parts of the code it generates and then run from there without spending hours debugging why a pin isn’t working how I expect it to.
My first time using CubeMX I ran through it quickly, switching a single GPIO pin to an output pulled high to test a simple LED wired to an STM32F1 “blue pill” board. I was also using the CubeIDE at the time, which generated all of the compile/link/load commands I needed in a Makefile automatically too. Everything worked great, I saw what I expected, no problems.
When I went to alter some config and re-flash the board, I found the CubeIDE wouldn’t upload code to the board anymore. My laptop registered the plugged-in board, CubeIDE saw it, but it couldn’t connect to it to re-flash it. After literally multiple hours, I figured out that you have to manually configure your pins in CubeMX to support your preferred mode of debugging. Since I hadn’t set any mode in the Debug section of the pinout config, once my program was flashed the SWD pins on the chip weren’t configured at all. This meant that there was no way for the programmer to communicate serially with the chip anymore. Coming from a dev board that supported USB programming, this was a bit of a surprise to me!
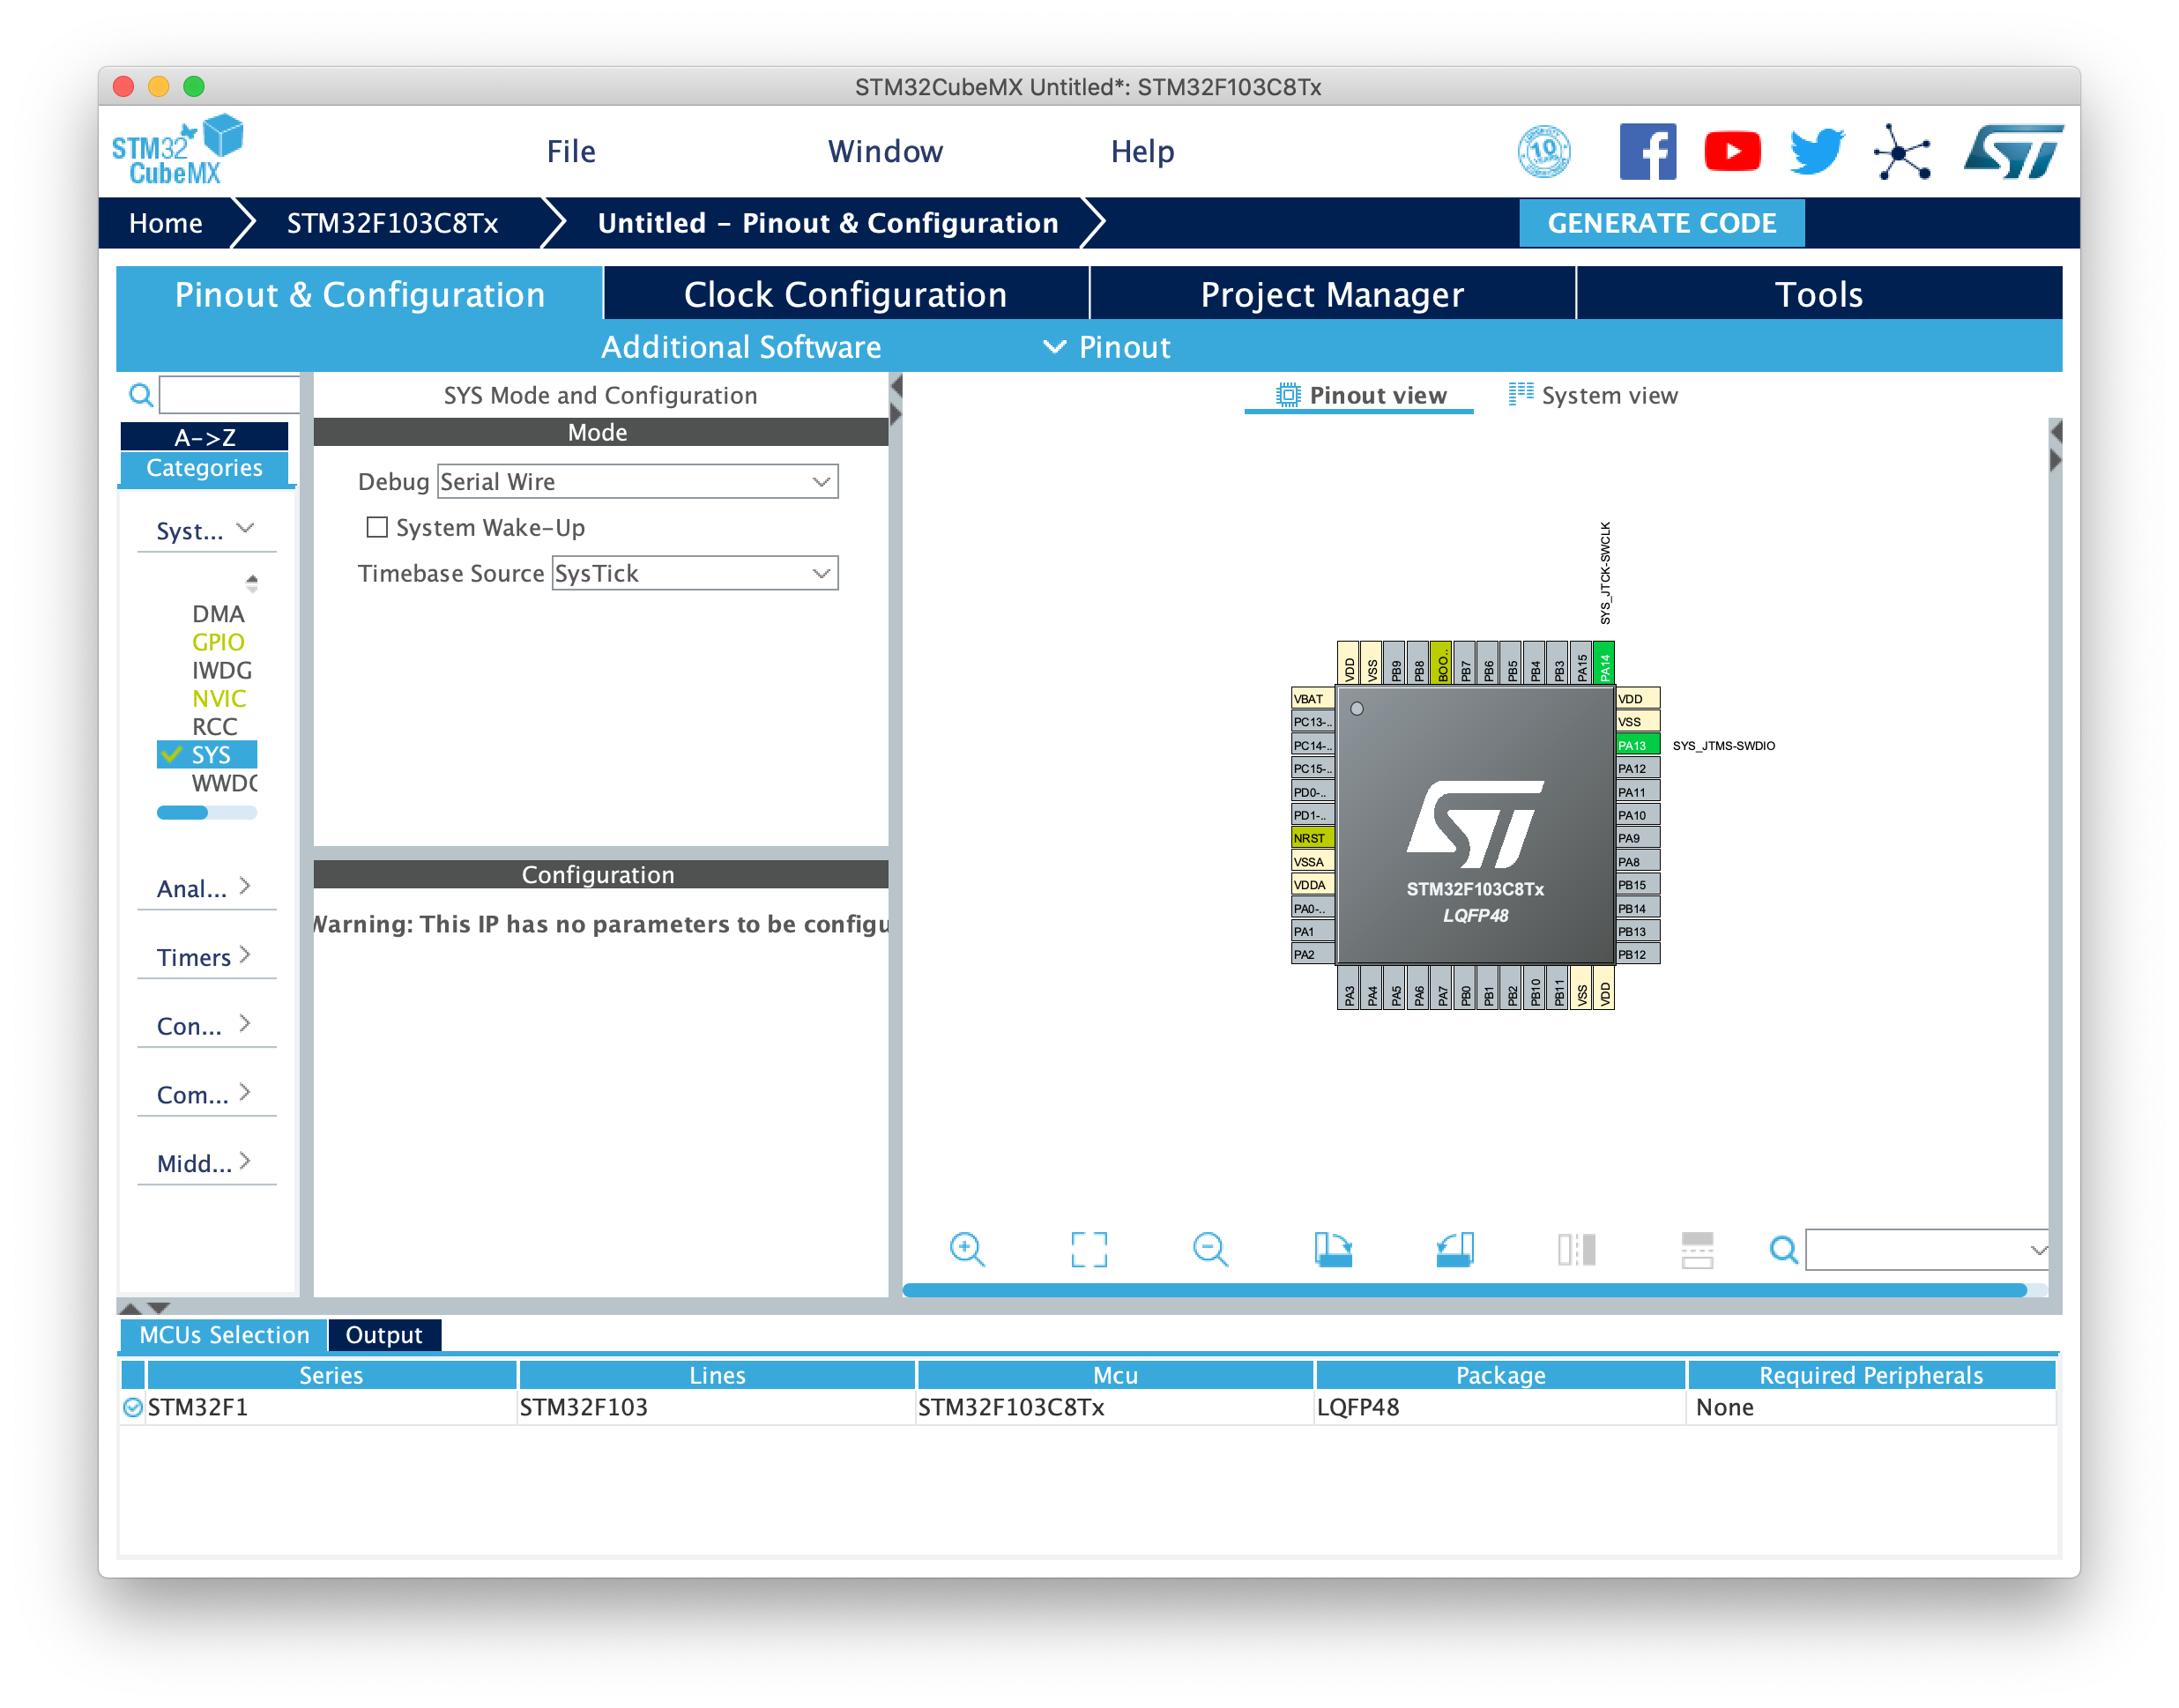
The debug pin setup can be chosen from a dropdown. Once selected, you can see the I/O and clock pins configured in the right-hand pinout at pins 13 and 14 (right-click and open image in new tab for full-size)
Thankfully there’s a way to hold the chip in reset and fully reset the pinout to defaults using the STLink command-line programming tool. Once I got it back to defaults and ensured I had the Serial Wire debug option selected in CubeMX, I could repeatedly program the board with no problems.