AWS Cloudwatch logging for Lambda@Edge
“Dude, where’s my car logs?”
When attempting to deploy my S3 bucket-based site without a required index.html in every URL, I ran into quite the annoyance. No matter what I did, I couldn’t find the logs for my AWS Lambda@Edge redirect function anywhere.
A brief background:
Amazon Cloudwatch is an AWS service for monitoring and alerting on any of your other AWS resources. I’m sure it’s super powerful with loads of features, but I just use it for basic logs.
Amazon Lambda is an AWS service for running serverless code. This means that you write the code you normally would for anything you’d host on a server, but you don’t have to stand up and configure an S3 bucket, EC2 instance, or any other of the myriad of non-AWS server hosting solutions. Instead, you just drop that code into AWS, configure the routes that run it, and Amazon handles executing it upon each request without the overhead of hosting a constantly-running server.
Amazon Lambda@Edge Amazon Lambda, but deployed all over the world through Amazon’s CDN, Cloudfront.
When serving a static website from an S3 bucket, http access is included by default. Simply turn on the setting for static site hosting in the bucket’s configuration and you’re all set. To restrict access to https-only, Amazon makes you route through their Cloudfront CDN. This is a relatively painless setup to go through, and after a couple of hiccups with the SSL certs I got configured just fine. It even allows for alternate domain prefixes, so https://www.brian.team would behave the same as https://brian.team.
In the Cloudfront instance configuration, you have the option to provide the filename in your bucket that it should serve the user when they navigate to the root of your website but with no file specified.
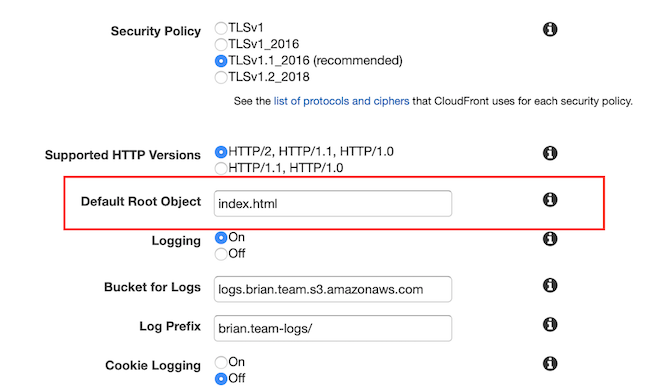
By setting this to index.html, navigating to https://brian.team shows my landing page, versus forcing users to type in https://brian.team/index.html. However, Cloudfront will only do this for your root path. Any subdirectories like https://brian.team/engineering will result in a request failure. This seems like a pretty dumb implementation in my opinion, but I digress.
After a quick Google, it’s pretty clear that most people solve this by redirecting anything with a lone trailing slash to an index.html-appended route by using an AWS Lambda function. However, because Cloudfront is a global CDN that’s handling requests at each of the deployed regions, the Lambda function must also be deployed individually to each of those regions to intercept the requests before they get to Cloudfront and fail. That’s where Lambda@Edge comes in.
The basic setup for a Lambda@Edge function is quite easy and there are plenty of guides on Amazon’s site so no reason to repeat it here. This is what my redirect rule looks like in case anyone wants something a little more robust than just looking at trailing slashes:
exports.handler = async (event, context, callback) => {
    const staticDirs = [ "img", "css" ];
    const request = event.Records[0].cf.request;
    const requestUri = request.uri;
    var redirectedUri = requestUri;

    // Don't do anything for static request
    if (requestUri.match(/^\/(css|img)\//)) {
        return callback(null, request);
    }

    var containsIndex = requestUri.match(/\/index.html[\/]?$/);
    var hasTrailingSlash = requestUri.match(/\/$/);
    if (containsIndex) {
        if (hasTrailingSlash) {
            redirectedUri = requestUri.substring(0, requestUri.length - 1);
        }
    } else {
        if (!hasTrailingSlash) {
            redirectedUri += "/";
        }

        redirectedUri += "index.html";
    }


    console.log(`Redirecting request uri of ${requestUri} to indexed path ${redirectedUri}`);
    request.uri = redirectedUri;

    return callback(null, request);
};
I utilized the in-browser testing functionality (that I didn’t know existed) to write a couple of tests for scenarios like the user including index.html, trailing or non-trailing slashes, and static assets. By running these, I could make sure my logging line showed the expected output. There was also a handy link to view the logs in Cloudwatch. How convenient! Everything showed up and looked okay.
Side note: I had no idea how to code in the expected values for passing or failing tests. They seem to just always pass unless there’s a syntax error in the code. Seems like they’re only useful for a quick check to make sure everything’s in order
After setting my function to trigger on any request to my Cloudfront instance and deploying it, I verified that I could access all of the subdirectoy index pages of my site without having to include index.html. I also wanted to view the logs to double-check everything looked okay there and I wasn’t overlogging or doing something weird. When I went to Cloudwatch though, the only logs there were the ones from my test runs. I battled this for over an hour, making sure all my services (S3, Cloudwatch, Lambda) were in the same region (N. Virginia the OG), regenerating the SSL certs for my Cloudwatch instance, resetting the permissions for the Lambda function to log to Cloudwatch, nothing worked. Everything I could find online was simply because people didn’t have a loose enough definition for Cloudwatch logging permissions in the IAM role they assigned their Lambda function, but I had chosen the option to let AWS configure the role permissions so I was confused how that could be the issue. I ended up manually changing them to the freest they could be (create any log streams and write logs to any streams) versus having them be restricted just to the function-specific stream. Still, nothing worked. The most baffling thing for me was how the tests could be logging correctly but not when it was deployed.
Finally I thought to specify in my searches that my issues were with Lambda@Edge, not just Lambda, and sure enough I immediately found the problem. Since the function is deployed to many different regions, it logs to the Cloudwatch region that it’s running and receiving requests in. Therefore, I just needed to find out what region was receiving my web requests.
To see invocations of your Lambda function by region, go to the Cloudfront console and select the Monitoring tab on the left-hand side. Skip over the Cloudfront section up top and select your Lambda function below, then click View function metrics.
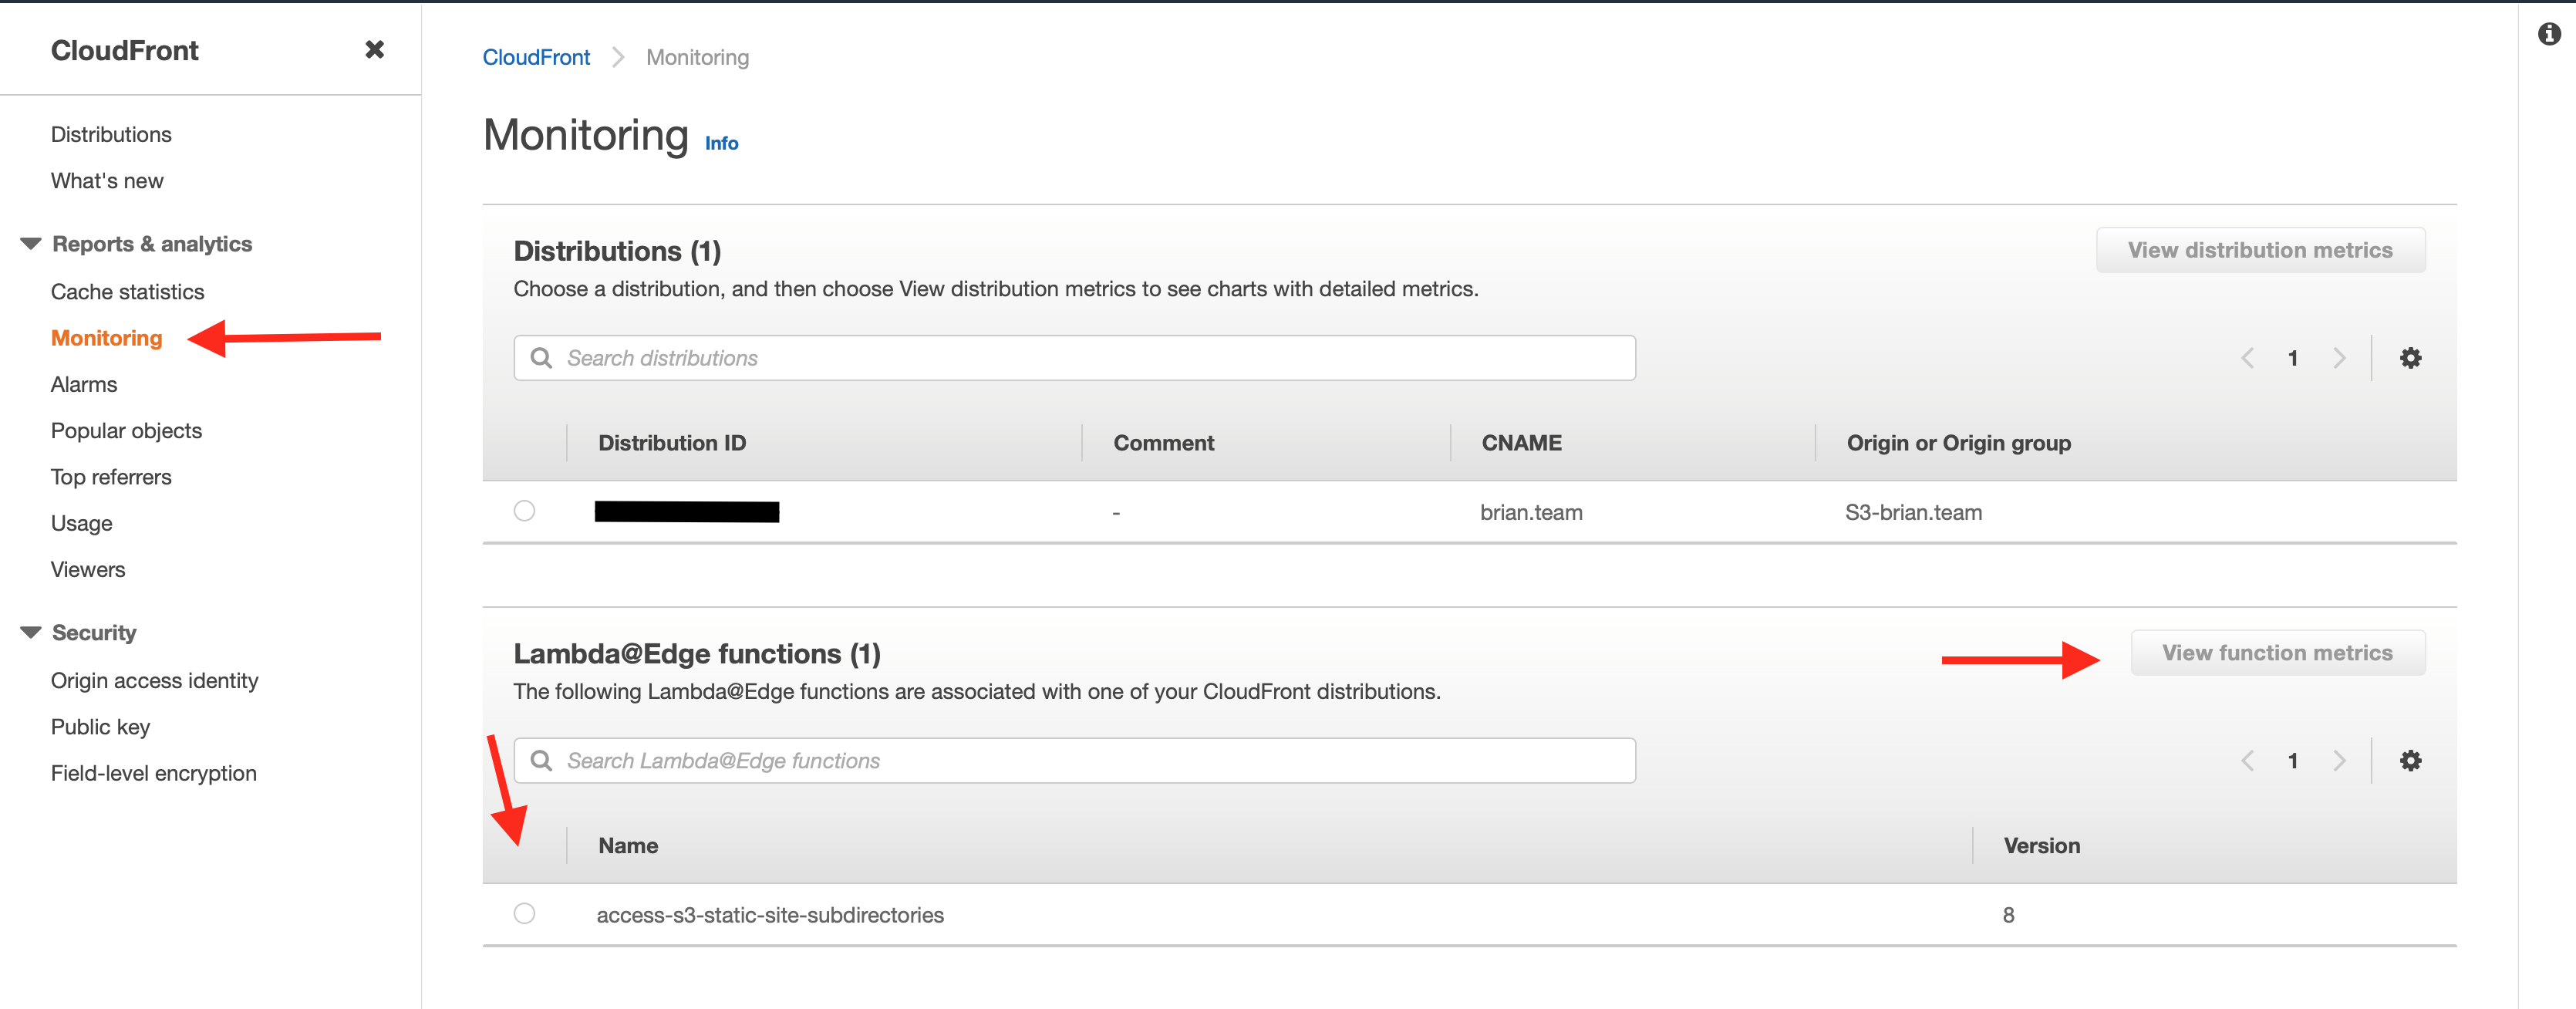
One important thing to note is the version of your function that is deployed. It’s very easy to make changes to the Lambda code or trigger and test them, but not deploy them to Cloudfront. If the version that’s testing correctly in the Lambda console doesn’t match what’s shown in the Lambda@Edge monitoring list, double-check you’ve deployed your latest version from that function’s configuration in the Lambda console.
Tada! You should see a chart of every invocation of your function broken down by region. Then simply navigate back to Cloudwatch and choose the correct region in the upper right-hand corner, and your logs should appear.
Fun fact: Switching Cloudwatch regions was one of the first things I tried when debugging. I was in the N. Virginia region and chose the N. California one since I live in San Francisco. Imagine my frustration when I eventually figured these steps out and saw that my requests had gone through the Oregon region. Could have saved myself an hour if I had just guessed right…